


KubeEye is an open-source diagnostic tool for identifying various Kubernetes cluster issues automatically, such as misconfigurations, unhealthy components and node failures. It empowers cluster operators to manage and troubleshoot clusters in a timely and graceful manner. Developed in Go on the basis of Polaris and Node Problem Detector, KubeEye is equipped with a series of built-in rules for exception detection. Besides pre-defined rules, KubeEye also supports customized rules.
![]()
Why Open Source
As the de facto standard in container orchestration, Kubernetes features a powerful and flexible architecture which supports various cloud-native add-ons. That said, there are some obstacles and problems which have haunted cluster operators and engineers for so long, such as:
CPU, memory or disk exceptions
Kernel deadlock and filesystem damage
Container runtime daemon not responding
Unhealthy etcd
Request and limit blackbox
Pod failures
Certificates expiring
Docker service failures
OOM (Out of Memory)
In fact, the problems listed here are just the tip of the iceberg. The majority of the cluster issues lies below the surface as they are not directly detectable from the cluster control plane. In other words, even with these potential issues, Kubernetes may continue to schedule Pods onto malfunctioning nodes, thus posing a greater threat to the stability and security of your cluster.
To identify these issues in time, the KubeSphere team developed KubeEye with over three years of expertise in Kubernetes cluster management and maintenance in production for both community users and commercial customers.
What Can KubeEye Do
Identify and detect problems in your Kubernetes cluster control plane, including
kube-apiserver,kube-controller-managerandetcd.Identify and detect various node problems, including memory, CPU and disk pressure, and unexpected kernel issues.
Validate YAML specifications of your workloads for best practices and compliance in the industry, thus improving cluster stability.
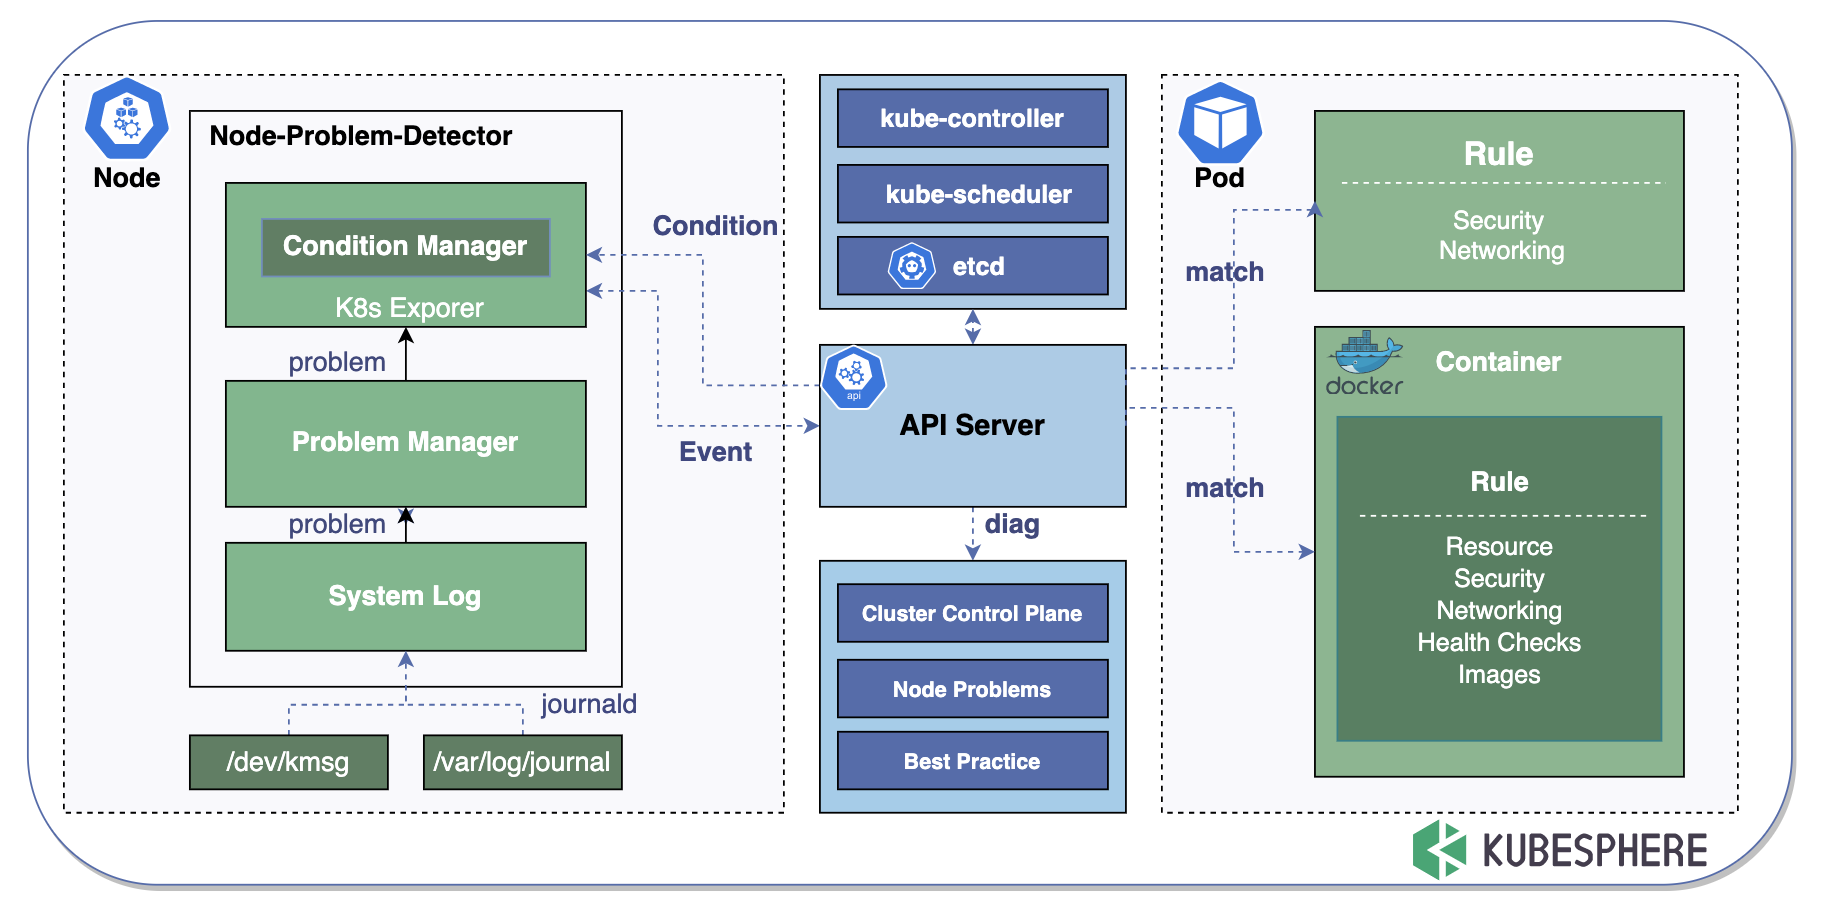
KubeEye Architecture
By calling the Kubernetes API, KubeEye gets diagnostic data as it matches key error messages in logs with rules of container syntax on a regular basis. See the architecture graph below:
Checklist
Here is a list including built-in items that will be checked by KubeEye. Unmarked items are still in development.
| YES/NO | CHECK ITEM | Description |
|---|---|---|
| Yes | ETCDHealthStatus | If etcd is up and running |
| Yes | ControllerManagerHealthStatus | If Kubernetes kube-controller-manager is up and running |
| Yes | SchedulerHealthStatus | If Kubernetes kube-scheduler is up and running |
| Yes | NodeMemory | If node memory usage is above the threshold |
| Yes | DockerHealthStatus | If Docker is up and running |
| Yes | NodeDisk | If node disk usage is above the threshold |
| Yes | KubeletHealthStatus | If kubelet is active and running normally |
| Yes | NodeCPU | If node cpu usage is above the threshold |
| Yes | NodeCorruptOverlay2 | Overlay2 is not available |
| Yes | NodeKernelNULLPointer | The node displays NotReady |
| Yes | NodeDeadlock | A deadlock happens when two or more processes are waiting for each other as they compete for resources |
| Yes | NodeOOM | Monitor processes that consume too much memory, especially those consuming plenty of memory very quickly. The kernel kills them to prevent them from running out of memory |
| Yes | NodeExt4Error | Ext4 mounting error |
| Yes | NodeTaskHung | Check if there is a process in state D for more than 120s |
| Yes | NodeUnregisterNetDevice | Check the corresponding network |
| Yes | NodeCorruptDockerImage | Check Docker images |
| Yes | NodeAUFSUmountHung | Check storage |
| Yes | NodeDockerHung | As Docker hangs, you can check Docker logs |
| Yes | PodSetLivenessProbe | If the liveness probe is set for every container in a Pod |
| Yes | PodSetTagNotSpecified | The mirror address does not declare a tag or the tag is latest |
| Yes | PodSetRunAsPrivileged | Running a Pod in a privileged mode means that the Pod can access the host’s resources and kernel capabilities |
| Yes | PodSetImagePullBackOff | The Pod cannot pull the image properly, so it can be pulled manually on the corresponding node |
| Yes | PodSetImageRegistry | Check if the image form is in the corresponding registry |
| Yes | PodSetCpuLimitsMissing | No CPU resource limit is declared |
| Yes | PodNoSuchFileOrDirectory | Check if the corresponding file exists inside the container |
| Yes | PodIOError | Caused by file IO performance bottlenecks |
| Yes | PodNoSuchDeviceOrAddress | Check the corresponding network |
| Yes | PodInvalidArgument | Check the corresponding storage |
| Yes | PodDeviceOrResourceBusy | Check the corresponding directory and PID |
| Yes | PodFileExists | Check existing files |
| Yes | PodTooManyOpenFiles | The number of open files or socket connections exceeds the system set value |
| Yes | PodNoSpaceLeftOnDevice | Check disk and inode usage |
| Yes | NodeApiServerExpiredPeriod | Check if the apiserver certificate expires in less than 30 days |
| Yes | PodSetCpuRequestsMissing | No CPU resource request is declared |
| Yes | PodSetHostIPCSet | Set the host IP |
| Yes | PodSetHostNetworkSet | Set the host network |
| Yes | PodHostPIDSet | Set the host PID |
| Yes | PodMemoryRequestsMiss | No memory resource request is declared |
| Yes | PodSetHostPort | Set the host port |
| Yes | PodSetMemoryLimitsMissing | No memory resource limit is declared |
| Yes | PodNotReadOnlyRootFiles | The file system is not set to read-only |
| Yes | PodSetPullPolicyNotAlways | The image pulling policy is not Always |
| Yes | PodSetRunAsRootAllowed | Executed as the root user |
| Yes | PodDangerousCapabilities | You have the dangerous option in capabilities such as ALL, SYS_ADMIN and NET_ADMIN |
| Yes | PodlivenessProbeMissing | The readiness probe is not set |
| Yes | privilegeEscalationAllowed | Privilege escalation is allowed |
| NodeNotReadyAndUseOfClosedNetworkConnection | http2-max-streams-per-connection | |
| NodeNotReady | Fail to start ContainerManager; cannot set the property TasksAccounting, or unknown properties |
Get Started with KubeEye
Clone the KubeEye GitHub repository and install the tool.
git clone https://github.com/kubesphere/kubeeye.gitcd kubeeyemake installNote
You can also download the executable file from the GitHub release page of KubeEye.Install Node Problem Detector (Optional), which will run as a DaemonSet in your cluster. You only need to install NPD when you want detailed reports.
ke install npdUse KubeEye to make a diagnosis of your cluster.
$ ke diag
NODENAME        SEVERITY     HEARTBEATTIME               REASON              MESSAGE
node18          Fatal        2020-11-19T10:32:03+08:00   NodeStatusUnknown   Kubelet stopped posting node status.
node19          Fatal        2020-11-19T10:31:37+08:00   NodeStatusUnknown   Kubelet stopped posting node status.
node2           Fatal        2020-11-19T10:31:14+08:00   NodeStatusUnknown   Kubelet stopped posting node status.
node3           Fatal        2020-11-27T17:36:53+08:00   KubeletNotReady     Container runtime not ready: RuntimeReady=false reason:DockerDaemonNotReady message:docker: failed to get docker version: Cannot connect to the Docker daemon at unix:///var/run/docker.sock. Is the docker daemon running?

NAME            SEVERITY     TIME                        MESSAGE
scheduler       Fatal        2020-11-27T17:09:59+08:00   Get http://127.0.0.1:10251/healthz: dial tcp 127.0.0.1:10251: connect: connection refused
etcd-0          Fatal        2020-11-27T17:56:37+08:00   Get https://192.168.13.8:2379/health: dial tcp 192.168.13.8:2379: connect: connection refused

NAMESPACE       SEVERITY     PODNAME                                          EVENTTIME                   REASON                MESSAGE
default         Warning      node3.164b53d23ea79fc7                           2020-11-27T17:37:34+08:00   ContainerGCFailed     rpc error: code = Unknown desc = Cannot connect to the Docker daemon at unix:///var/run/docker.sock. Is the docker daemon running?
default         Warning      node3.164b553ca5740aae                           2020-11-27T18:03:31+08:00   FreeDiskSpaceFailed   failed to garbage collect required amount of images. Wanted to free 5399374233 bytes, but freed 416077545 bytes
default         Warning      nginx-b8ffcf679-q4n9v.16491643e6b68cd7           2020-11-27T17:09:24+08:00   Failed                Error: ImagePullBackOff
default         Warning      node3.164b5861e041a60e                           2020-11-27T19:01:09+08:00   SystemOOM             System OOM encountered, victim process: stress, pid: 16713
default         Warning      node3.164b58660f8d4590                           2020-11-27T19:01:27+08:00   OOMKilling            Out of memory: Kill process 16711 (stress) score 205 or sacrifice child Killed process 16711 (stress), UID 0, total-vm:826516kB, anon-rss:819296kB, file-rss:0kB, shmem-rss:0kB
insights-agent  Warning      workloads-1606467120.164b519ca8c67416            2020-11-27T16:57:05+08:00   DeadlineExceeded      Job was active longer than specified deadline
kube-system     Warning      calico-node-zvl9t.164b3dc50580845d               2020-11-27T17:09:35+08:00   DNSConfigForming      Nameserver limits were exceeded, some nameservers have been omitted, the applied nameserver line is: 100.64.11.3 114.114.114.114 119.29.29.29
kube-system     Warning      kube-proxy-4bnn7.164b3dc4f4c4125d                2020-11-27T17:09:09+08:00   DNSConfigForming      Nameserver limits were exceeded, some nameservers have been omitted, the applied nameserver line is: 100.64.11.3 114.114.114.114 119.29.29.29
kube-system     Warning      nodelocaldns-2zbhh.164b3dc4f42d358b              2020-11-27T17:09:14+08:00   DNSConfigForming      Nameserver limits were exceeded, some nameservers have been omitted, the applied nameserver line is: 100.64.11.3 114.114.114.114 119.29.29.29

NAMESPACE       SEVERITY     NAME                      KIND         TIME                        MESSAGE
kube-system     Warning      node-problem-detector     DaemonSet    2020-11-27T17:09:59+08:00   [livenessProbeMissing runAsPrivileged]
kube-system     Warning      calico-node               DaemonSet    2020-11-27T17:09:59+08:00   [runAsPrivileged cpuLimitsMissing]
kube-system     Warning      nodelocaldns              DaemonSet    2020-11-27T17:09:59+08:00   [cpuLimitsMissing runAsPrivileged]
default         Warning      nginx                     Deployment   2020-11-27T17:09:59+08:00   [cpuLimitsMissing livenessProbeMissing tagNotSpecified]
insights-agent  Warning      workloads                 CronJob      2020-11-27T17:09:59+08:00   [livenessProbeMissing]
insights-agent  Warning      cronjob-executor          Job          2020-11-27T17:09:59+08:00   [livenessProbeMissing]
kube-system     Warning      calico-kube-controllers   Deployment   2020-11-27T17:09:59+08:00   [cpuLimitsMissing livenessProbeMissing]
kube-system     Warning      coredns                   Deployment   2020-11-27T17:09:59+08:00   [cpuLimitsMissing]
Add Custom Check Rules
In addition to the pre-defined diagnostic items and rules, KubeEye also supports customized rules. For example:
Make sure you have installed NPD.
ke install npdEdit its ConfigMap using Kubectl.
kubectl edit cm -n kube-system node-problem-detector-configAdd regular expression rules in the ConfigMap for exceptional logs.
Customize Best Practice Rules
Create a rule in YAML. For example, the rule below checks your Pod specification to make sure images only come from the authorized registry.
checks:
  imageFromUnauthorizedRegistry: warning

customChecks:
  imageFromUnauthorizedRegistry:
    promptMessage: When the corresponding rule does not match, show that image from an unauthorized registry.
    category: Images
    target: Container
    schema:
      '$schema': http://json-schema.org/draft-07/schema
      type: object
      properties:
        image:
          type: string
          not:
            pattern: ^quay.io
Save the file, such as
rule.yaml.Run KubeEye with the YAML file.
$ ke diag -f rule.yaml --kubeconfig ~/.kube/config
NAMESPACE     SEVERITY    NAME                      KIND         TIME                        MESSAGE
default       Warning     nginx                     Deployment   2020-11-27T17:18:31+08:00   [imageFromUnauthorizedRegistry]
kube-system   Warning     node-problem-detector     DaemonSet    2020-11-27T17:18:31+08:00   [livenessProbeMissing runAsPrivileged]
kube-system   Warning     calico-node               DaemonSet    2020-11-27T17:18:31+08:00   [cpuLimitsMissing runAsPrivileged]
kube-system   Warning     calico-kube-controllers   Deployment   2020-11-27T17:18:31+08:00   [cpuLimitsMissing livenessProbeMissing]
kube-system   Warning     nodelocaldns              DaemonSet    2020-11-27T17:18:31+08:00   [runAsPrivileged cpuLimitsMissing]
default       Warning     nginx                     Deployment   2020-11-27T17:18:31+08:00   [livenessProbeMissing cpuLimitsMissing]
kube-system   Warning     coredns                   Deployment   2020-11-27T17:18:31+08:00   [cpuLimitsMissing]
Roadmap
Going forward, KubeEye will add support for:
Fine-grained diagnostic items, such as the slow response time of Kubernetes clusters.
The diagnosis of KubeSphere components, such as DevOps and service mesh.
The diagnosis of cluster network and storage.
