


Deploy ClickHouse Operator and a ClickHouse Cluster on KubeSphere
ClickHouse is a column-oriented database management system (DBMS) for online analytical processing of queries (OLAP). RadonDB ClickHouse is a deeply customized ClickHouse cluster application maintaining ClickHouse cluster functions and featuring automated cluster management, data redistribution in clusters, and excellent performance with less cost.
This tutorial demonstrates how to deploy ClickHouse Operator and a ClickHouse Cluster on KubeSphere.
Prerequisites
- You need to enable the OpenPitrix system.
- You need to create a workspace, a project, and two user accounts (
ws-adminandproject-regular) for this tutorial. The accountws-adminmust be granted the role ofworkspace-adminin the workspace, and the accountproject-regularmust be invited to the project with the role ofoperator. This tutorial usesdemo-workspaceanddemo-projectfor demonstration. If they are not ready, refer to Create Workspaces, Projects, Users and Roles. - You need to enable the gateway in your project to provide external access. If they are not ready, refer to Project Gateway.
Hands-on Lab
Step 1: Deploy ClickHouse Operator
Log in to the KubeSphere Web console as
admin, and use Kubectl from the Toolbox in the lower-right corner to run the following command to install ClickHouse Operator. It is recommended that you have at least two worker nodes available in your cluster.$ kubectl apply -f https://raw.githubusercontent.com/radondb/radondb-clickhouse-kubernetes/master/clickhouse-operator-install.ymlNote
This command will install ClickHouse Operator in the namespacekube-system. Therefore, ClickHouse Operator only needs to be installed once in a Kubernetes cluster.You can see the expected output as below if the installation is successful.
$ kubectl apply -f https://raw.githubusercontent.com/radondb/radondb-clickhouse-kubernetes/main/clickhouse-operator-install.yml
customresourcedefinition.apiextensions.k8s.io/clickhouseinstallations.clickhouse.radondb.com created
customresourcedefinition.apiextensions.k8s.io/clickhouseinstallationtemplates.clickhouse.radondb.com created
customresourcedefinition.apiextensions.k8s.io/clickhouseoperatorconfigurations.clickhouse.radondb.com created
serviceaccount/clickhouse-operator created
clusterrole.rbac.authorization.k8s.io/clickhouse-operator-kube-system created
clusterrolebinding.rbac.authorization.k8s.io/clickhouse-operator-kube-system created
configmap/etc-clickhouse-operator-files created
configmap/etc-clickhouse-operator-confd-files created
configmap/etc-clickhouse-operator-configd-files created
configmap/etc-clickhouse-operator-templatesd-files created
configmap/etc-clickhouse-operator-usersd-files created
deployment.apps/clickhouse-operator created
service/clickhouse-operator-metrics created
You can run the following command to view the status of ClickHouse Operator resources.
$ kubectl get all --selector=app=clickhouse-operator -n kube-systemExpected output:
NAME                                      READY   STATUS    RESTARTS   AGE
pod/clickhouse-operator-6b8494c8f-tmkmn   2/2     Running   0          6m34s

NAME                                  TYPE        CLUSTER-IP     EXTERNAL-IP   PORT(S)    AGE
service/clickhouse-operator-metrics   ClusterIP   10.233.51.66   <none>        8888/TCP   6m34s

NAME                                  READY   UP-TO-DATE   AVAILABLE   AGE
deployment.apps/clickhouse-operator   1/1     1            1           6m34s

NAME                                            DESIRED   CURRENT   READY   AGE
replicaset.apps/clickhouse-operator-6b8494c8f   1         1         1       6m34s
Step 2: Add an app repository
Log out of KubeSphere and log back in as
ws-admin. Indemo-workspace, go to App Repositories under App Management, and then click Add.In the dialog that appears, enter
clickhousefor the app repository name andhttps://radondb.github.io/radondb-clickhouse-kubernetes/for the repository URL. Click Validate to verify the URL, and you will see a green check mark next to the URL if it is available. Click OK to continue.Your repository will display in the list after it is successfully imported to KubeSphere.
Step 3: Deploy a ClickHouse Cluster
Log out of KubeSphere and log back in as
project-regular. Indemo-project, go to Apps under Application Workloads and click Create.In the dialog that appears, select From App Template.
On the new page that appears, select clickhouse from the drop-down list and then click clickhouse-cluster.
On the Chart Files tab, you can view the configuration and download the
values.yamlfile. Click Install to continue.On the Basic Information page, confirm the app name, app version, and deployment location. Click Next to continue.
On the App Settings tab, you can change the YAML file to customize settings. In this tutorial, click Install to use the default settings.
After a while, you can see the app is in the Running status.
Step 4: View ClickHouse cluster status
In Workloads under Application Workloads, click the StatefulSets tab, and you can see the StatefulSets are up and running.
Click a single StatefulSet to go to its detail page. You can see the metrics in line charts over a period of time under the Monitoring tab.
In Pods under Application Workloads, you can see all the Pods are up and running.
In Persistent Volume Claims under Storage, you can see the ClickHouse Cluster components are using persistent volumes.
Usage of the persistent volume is also monitored. Click a persistent volume to go to its detail page.
On the Overview page of the project, you can see a list of resource usage in the current project.
Step 5: Access the ClickHouse cluster
Log out of KubeSphere and log back in as
admin. Hover your cursor over the hammer icon in the lower-right corner, and then select Kubectl.In the window that appears, run the following command and then navigate to the username and password of the ClickHouse cluster.
$ kubectl edit chi clickho-749j8s -n demo-project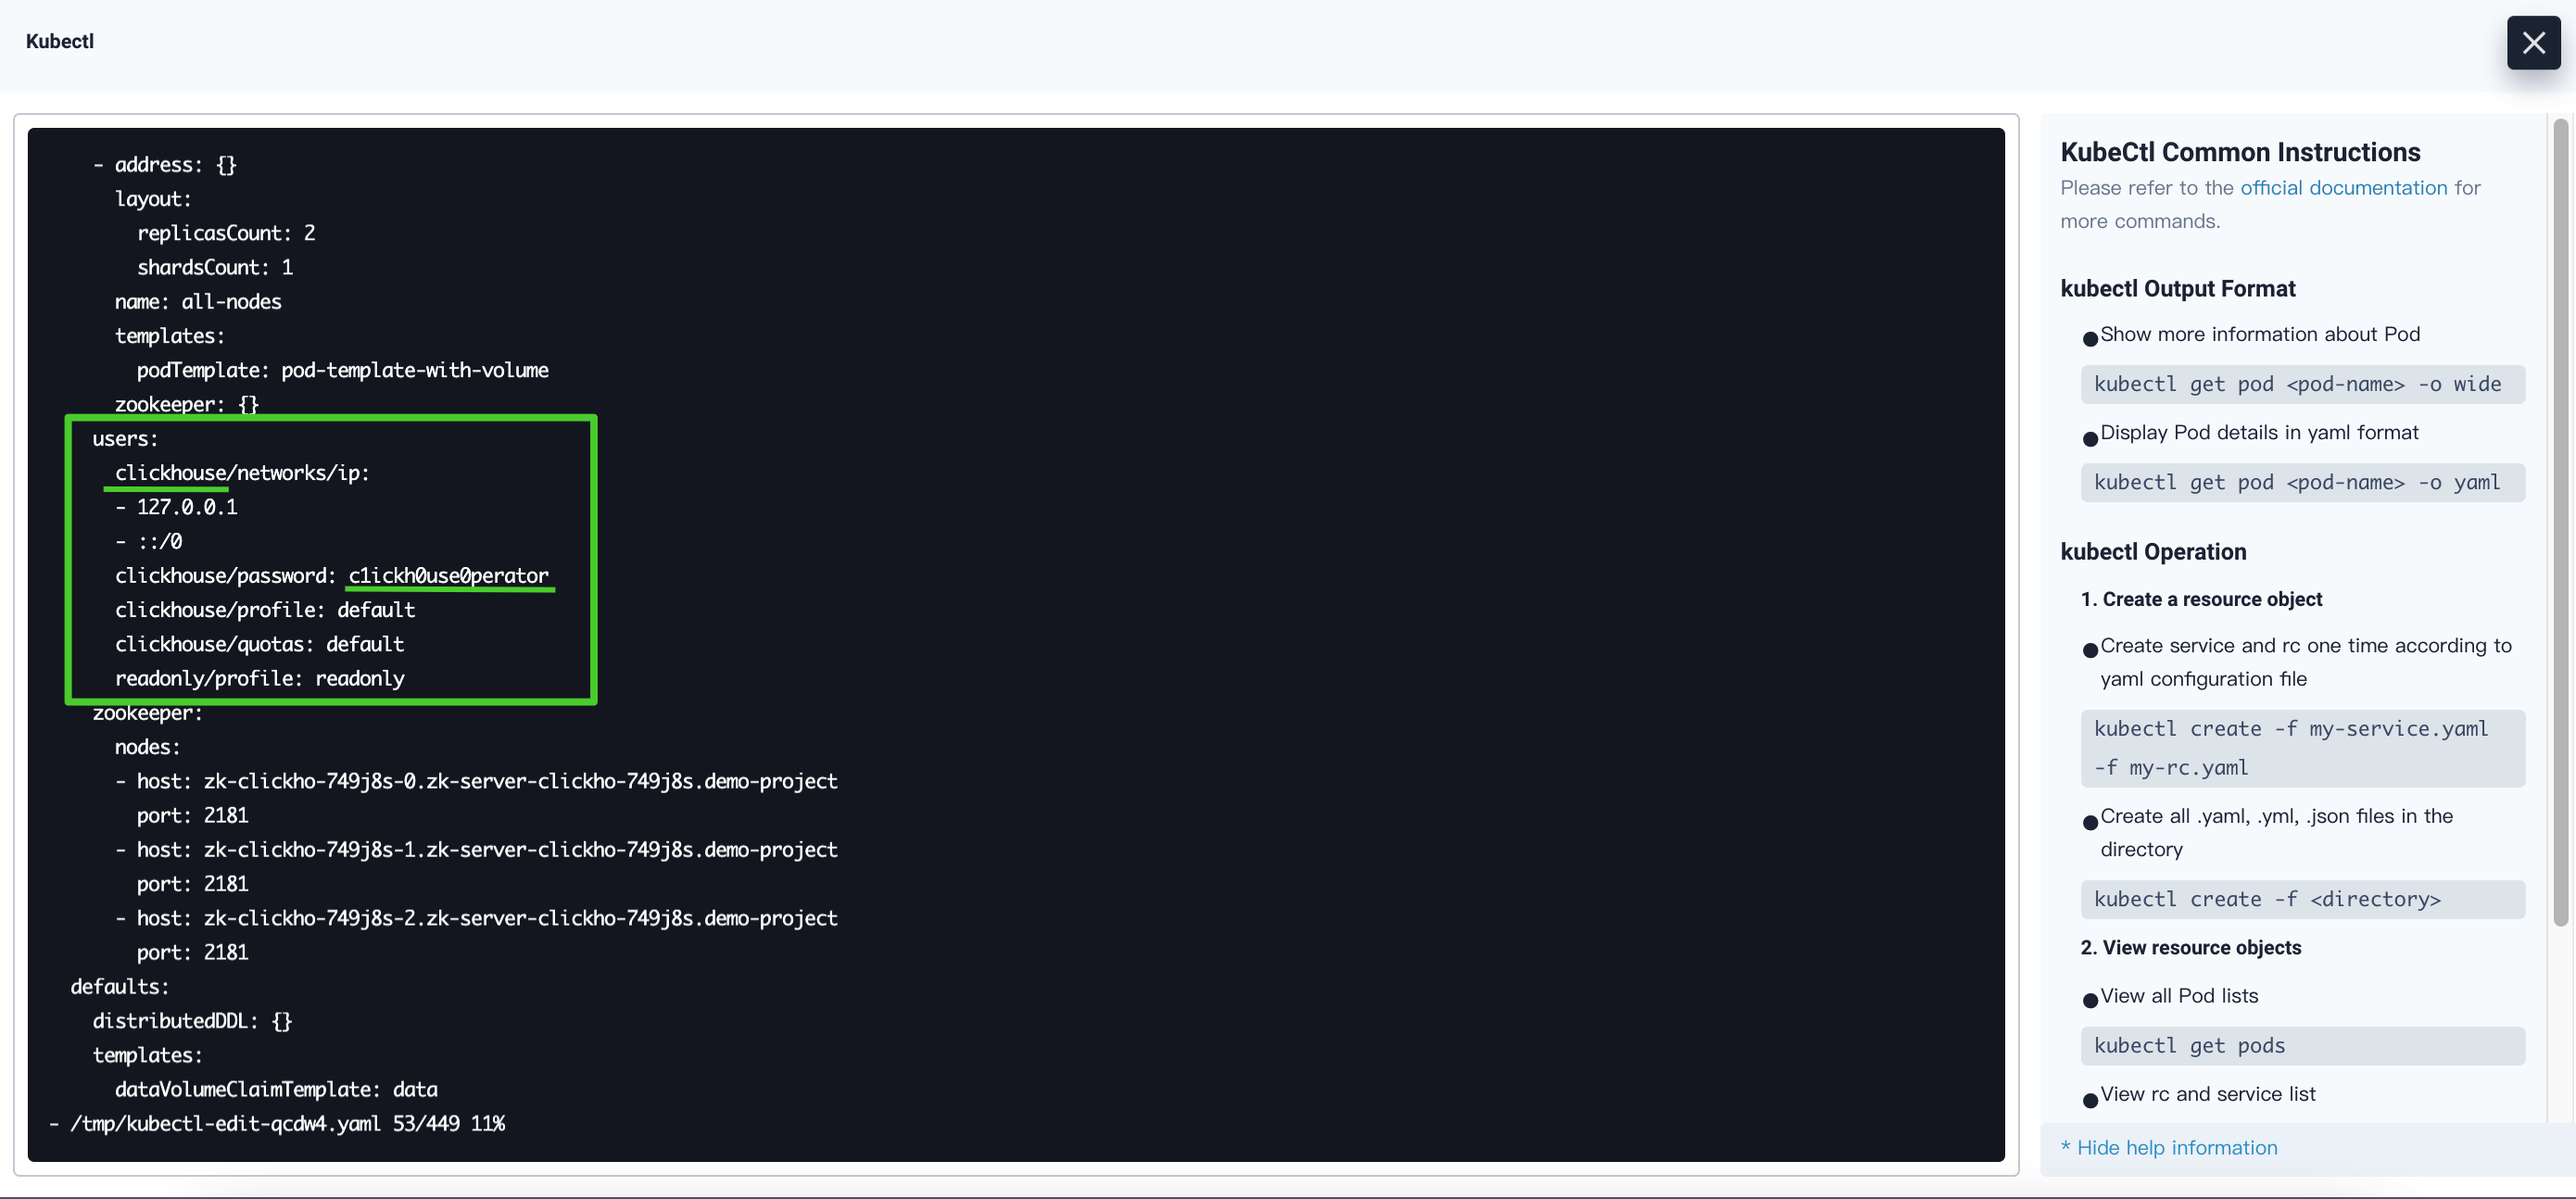
Note
In the above command,clickho-749j8sis the ClickHouse application name anddemo-projectis the project name. Make sure you use your own application name and project name.Run the following command to access the ClickHouse cluster, and then you can use command like
show databasesto interact with it.$ kubectl exec -it chi-clickho-749j8s-all-nodes-0-0-0 -n demo-project -- clickhouse-client --user=clickhouse --password=c1ickh0use0perator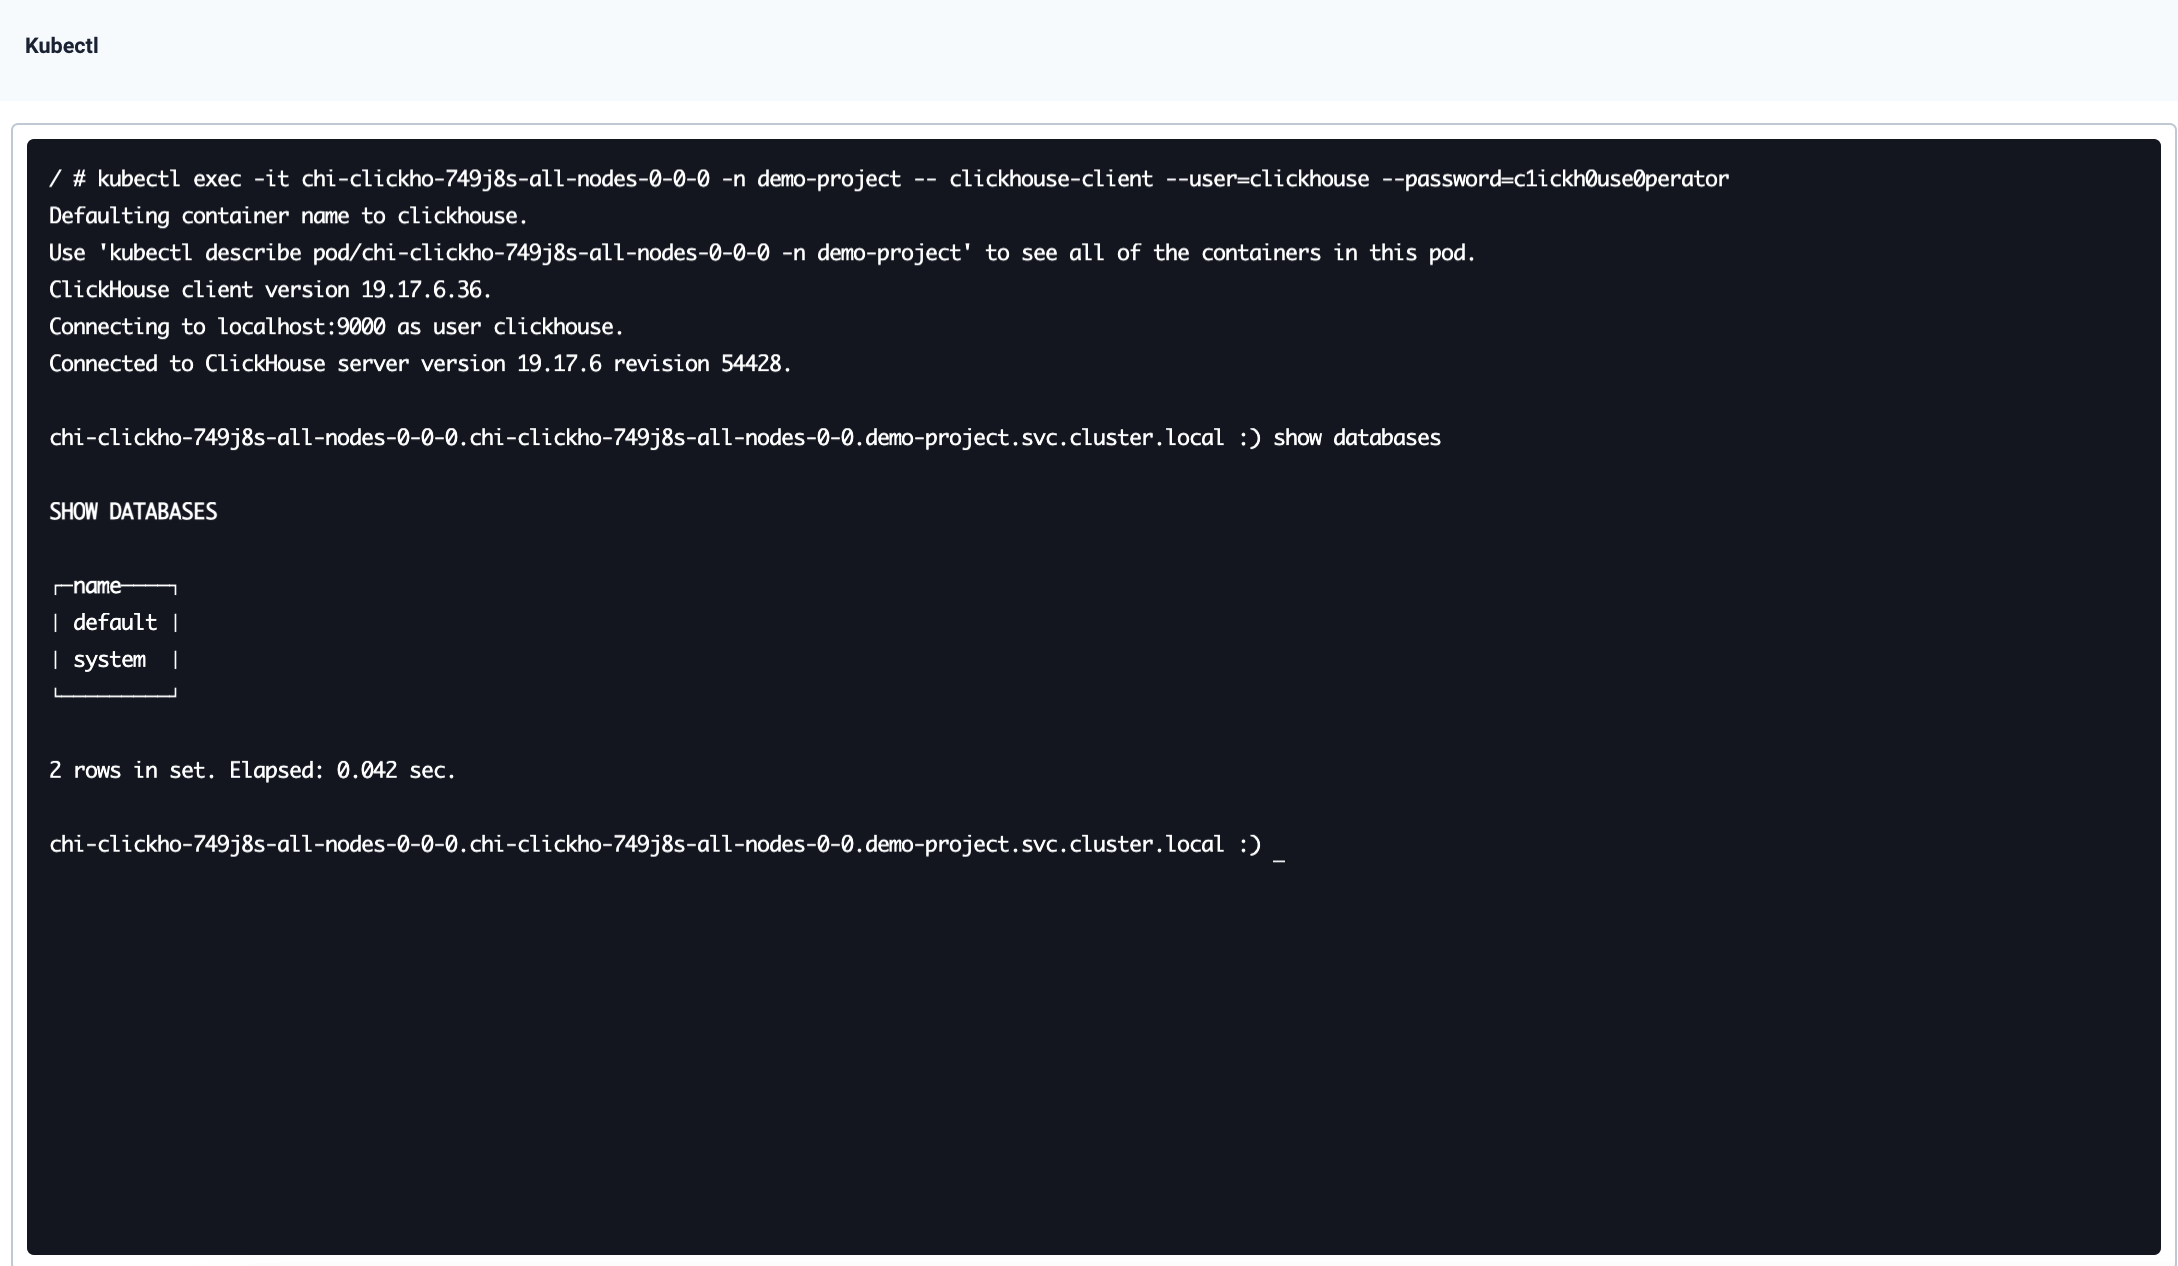
Note
In the above command,chi-clickho-749j8s-all-nodes-0-0-0is the Pod name and you can find it in Pods under Application Workloads. Make sure you use your own Pod name, project name, username, and password.
Feedback
Was this page Helpful?
Receive the latest news, articles and updates from KubeSphere
Thanks for the feedback. If you have a specific question about how to use KubeSphere, ask it on Slack. Open an issue in the GitHub repo if you want to report a problem or suggest an improvement.
 Previous

What’s on this Page