
Deploy Chaos Mesh on KubeSphere
Chaos Mesh is a cloud-native Chaos Engineering platform that orchestrates chaos in Kubernetes environments. With Chaos Mesh, you can test your system's resilience and robustness on Kubernetes by injecting various types of faults into Pods, network, file system, and even the kernel.
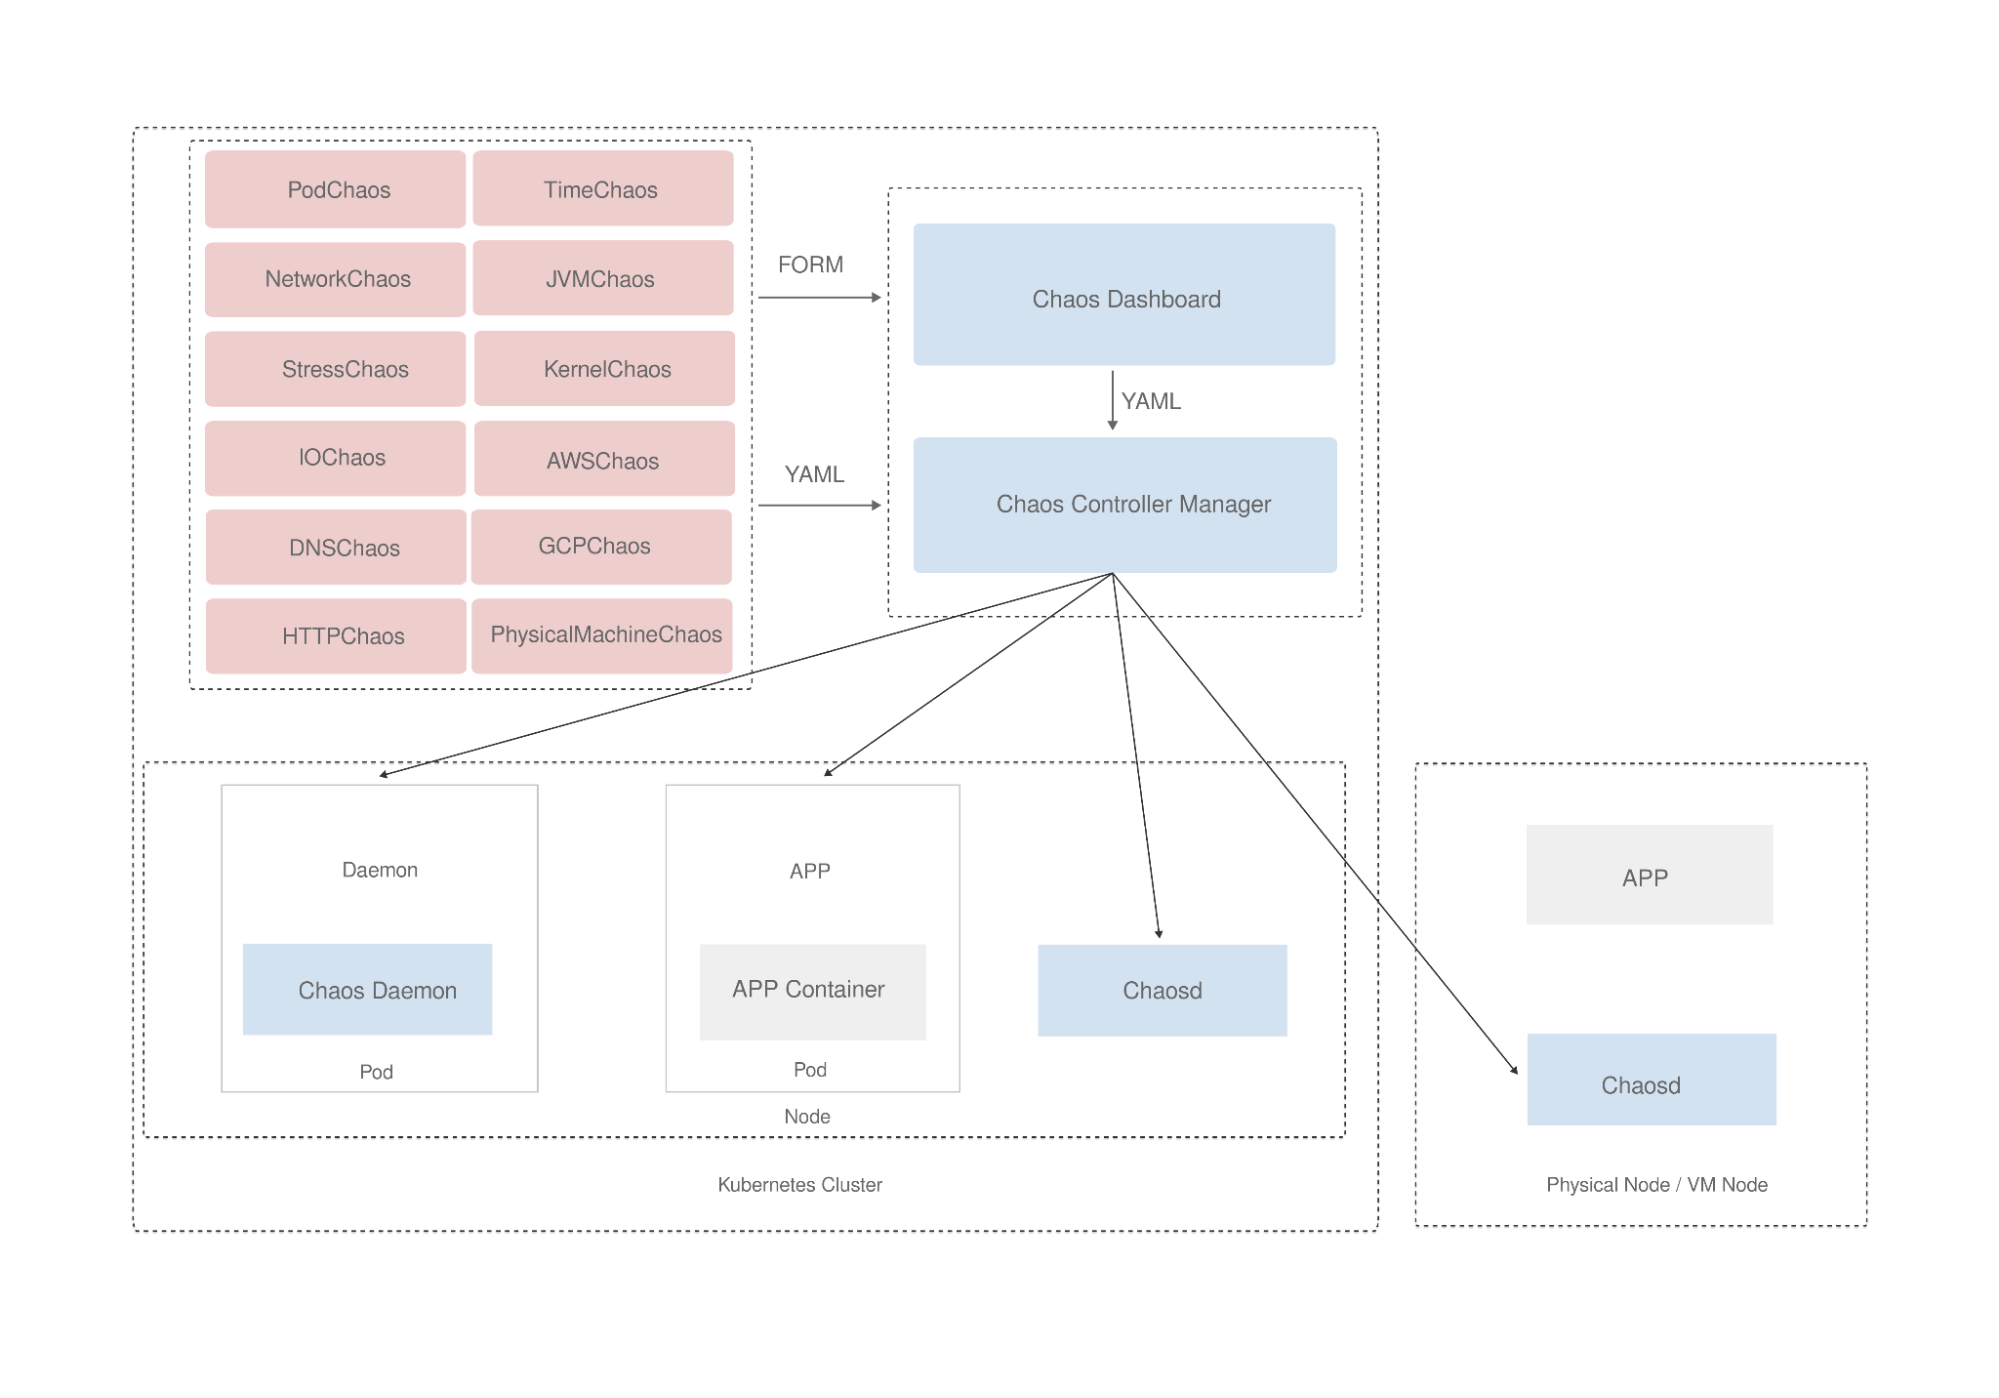
Enable App Store on KubeSphere
Make sure you have installed and enabled the KubeSphere App Store.
You need to create a workspace, a project, and a user account (project-regular) for this tutorial. The account needs to be a platform regular user and to be invited as the project operator with the operator role. For more information, see Create Workspaces, Projects, Users and Roles.
Chaos experiments with Chaos Mesh
Step 1: Deploy Chaos Mesh
Login KubeSphere as
project-regular, search for chaos-mesh in the App Store, and click on the search result to enter the app.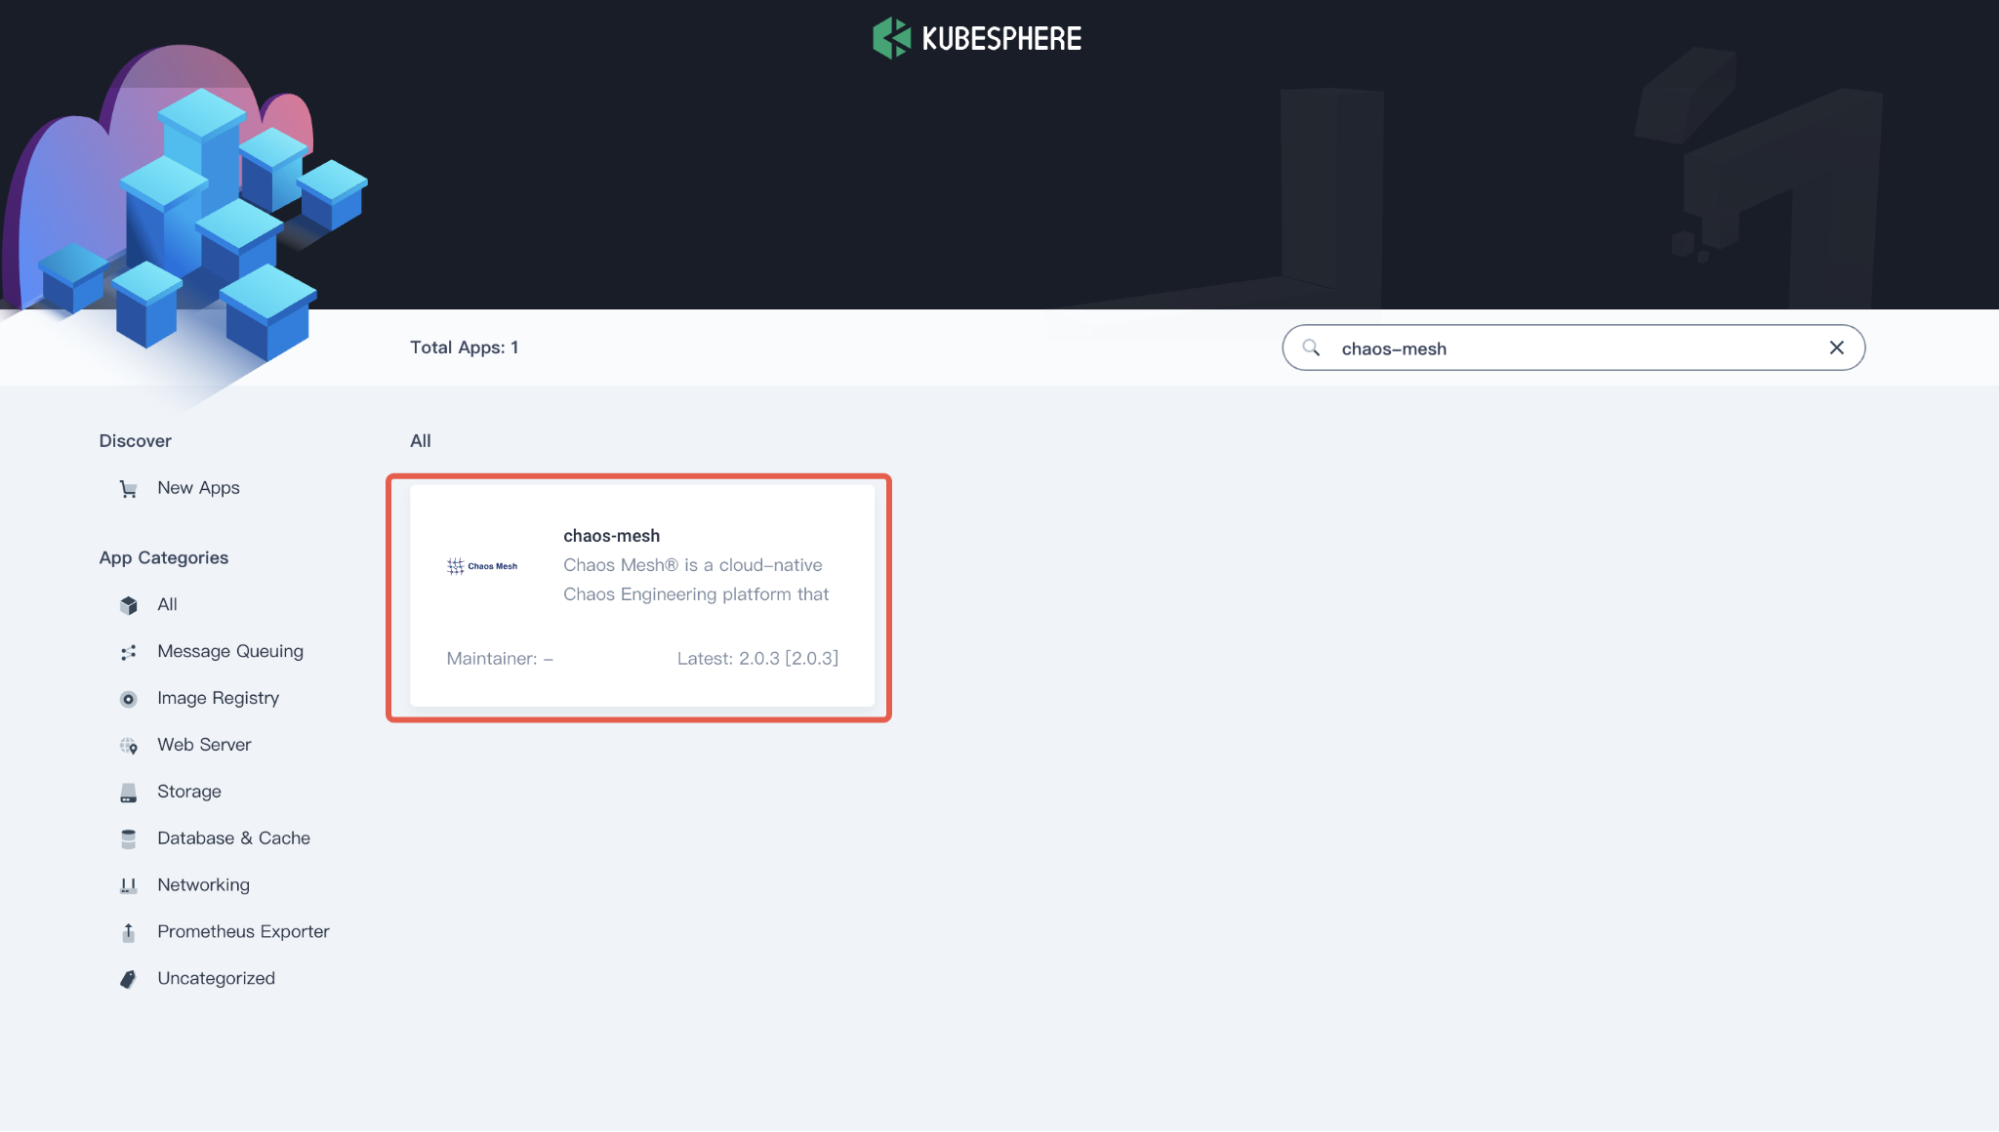
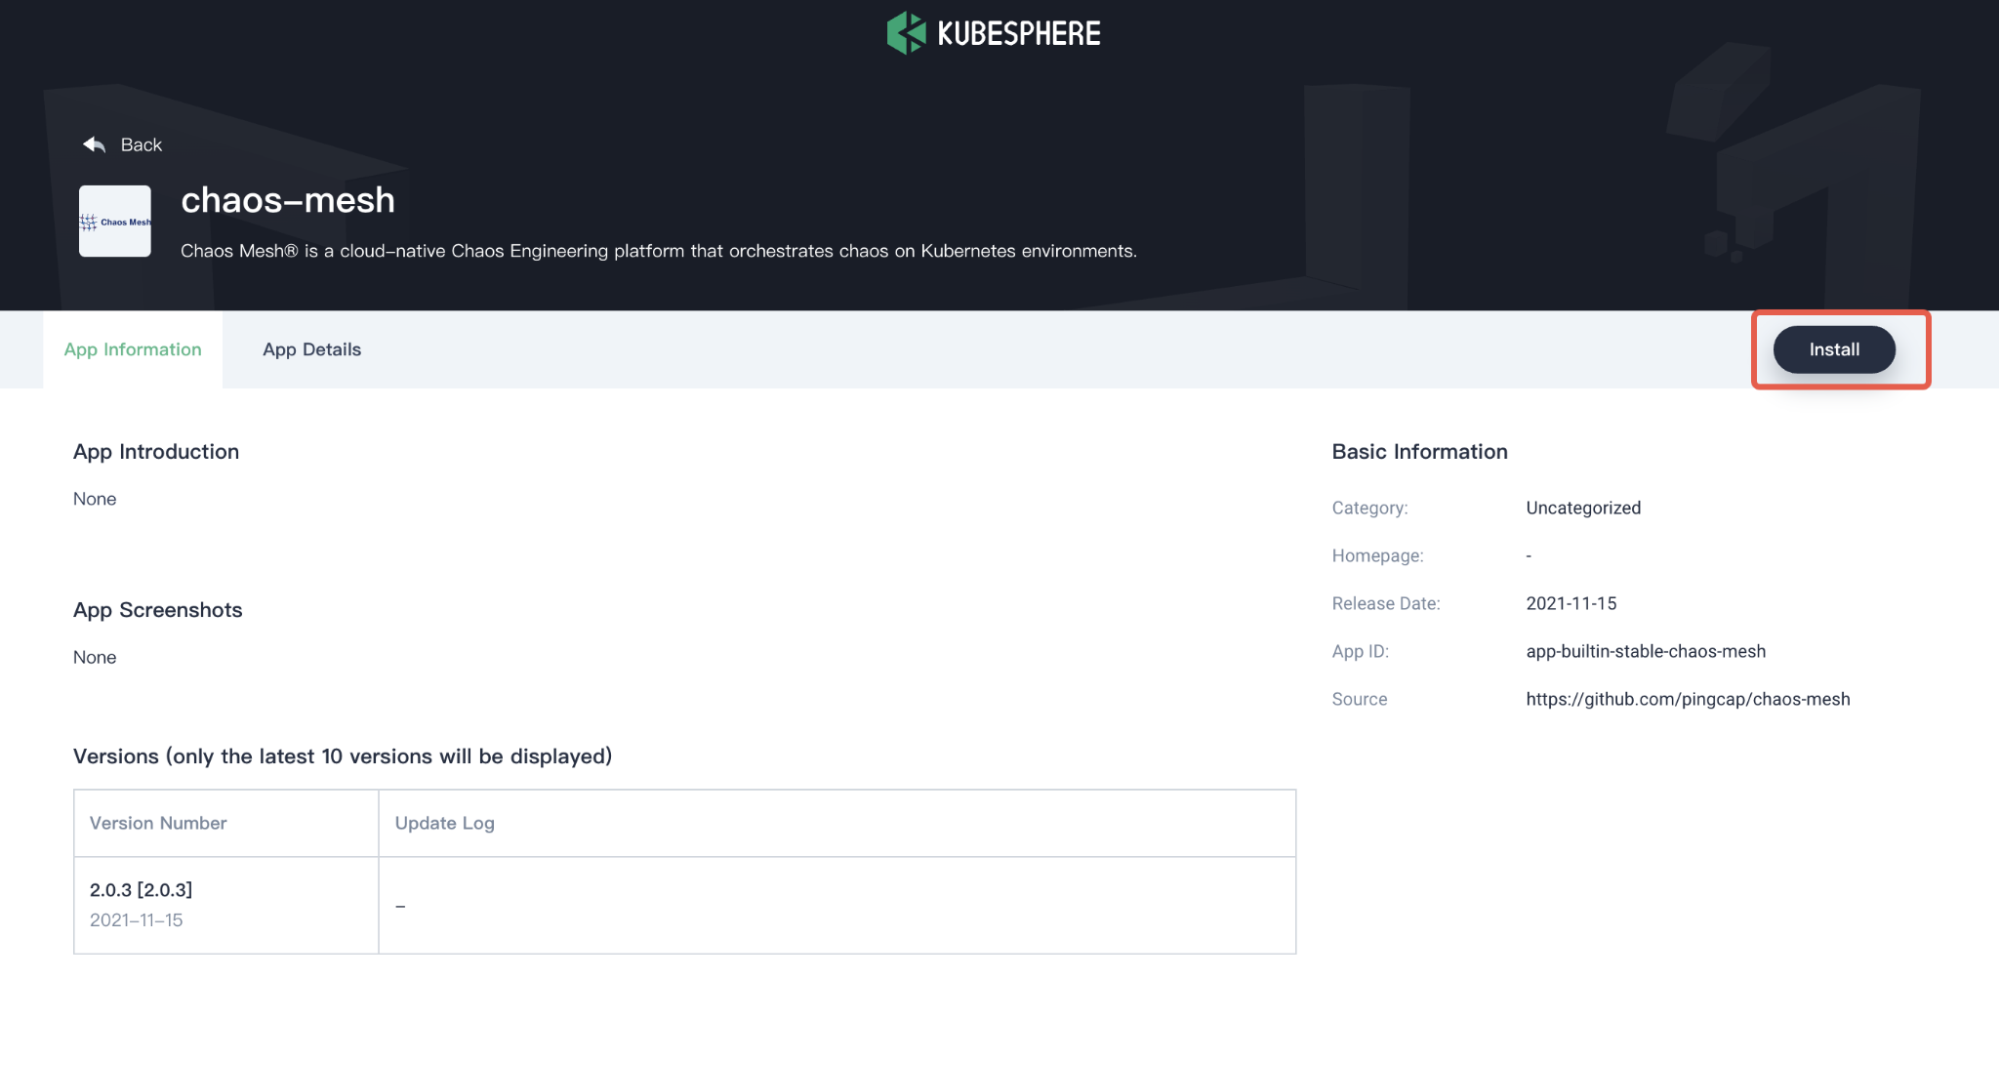
In the App Information page, click Install on the upper right corner.
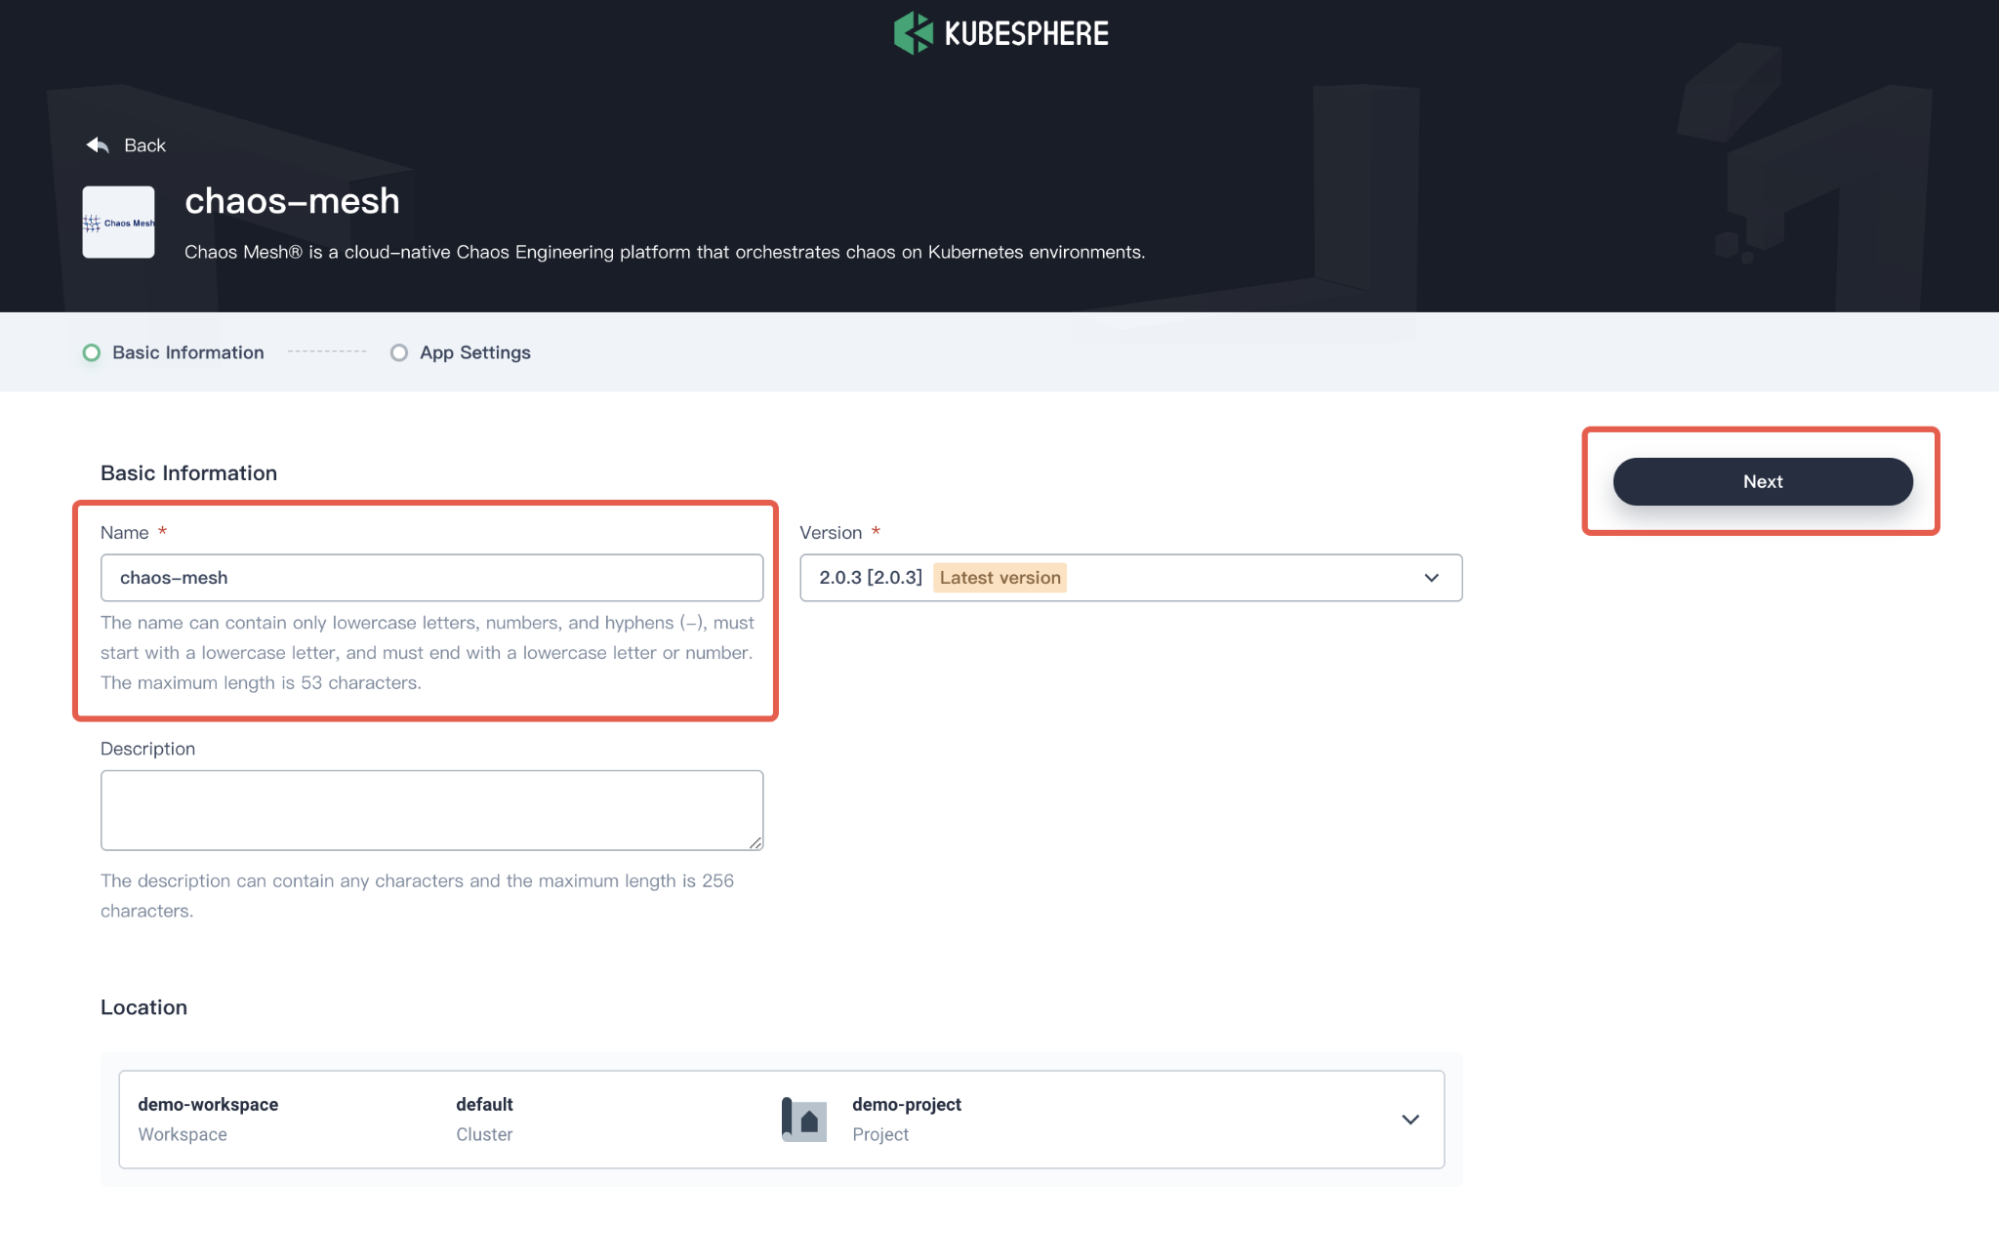
In the App Settings page, set the application Name, Location (as your Namespace), and App Version, and then click Next on the upper right corner.
Configure the
values.yamlfile as needed, or click Install to use the default configuration.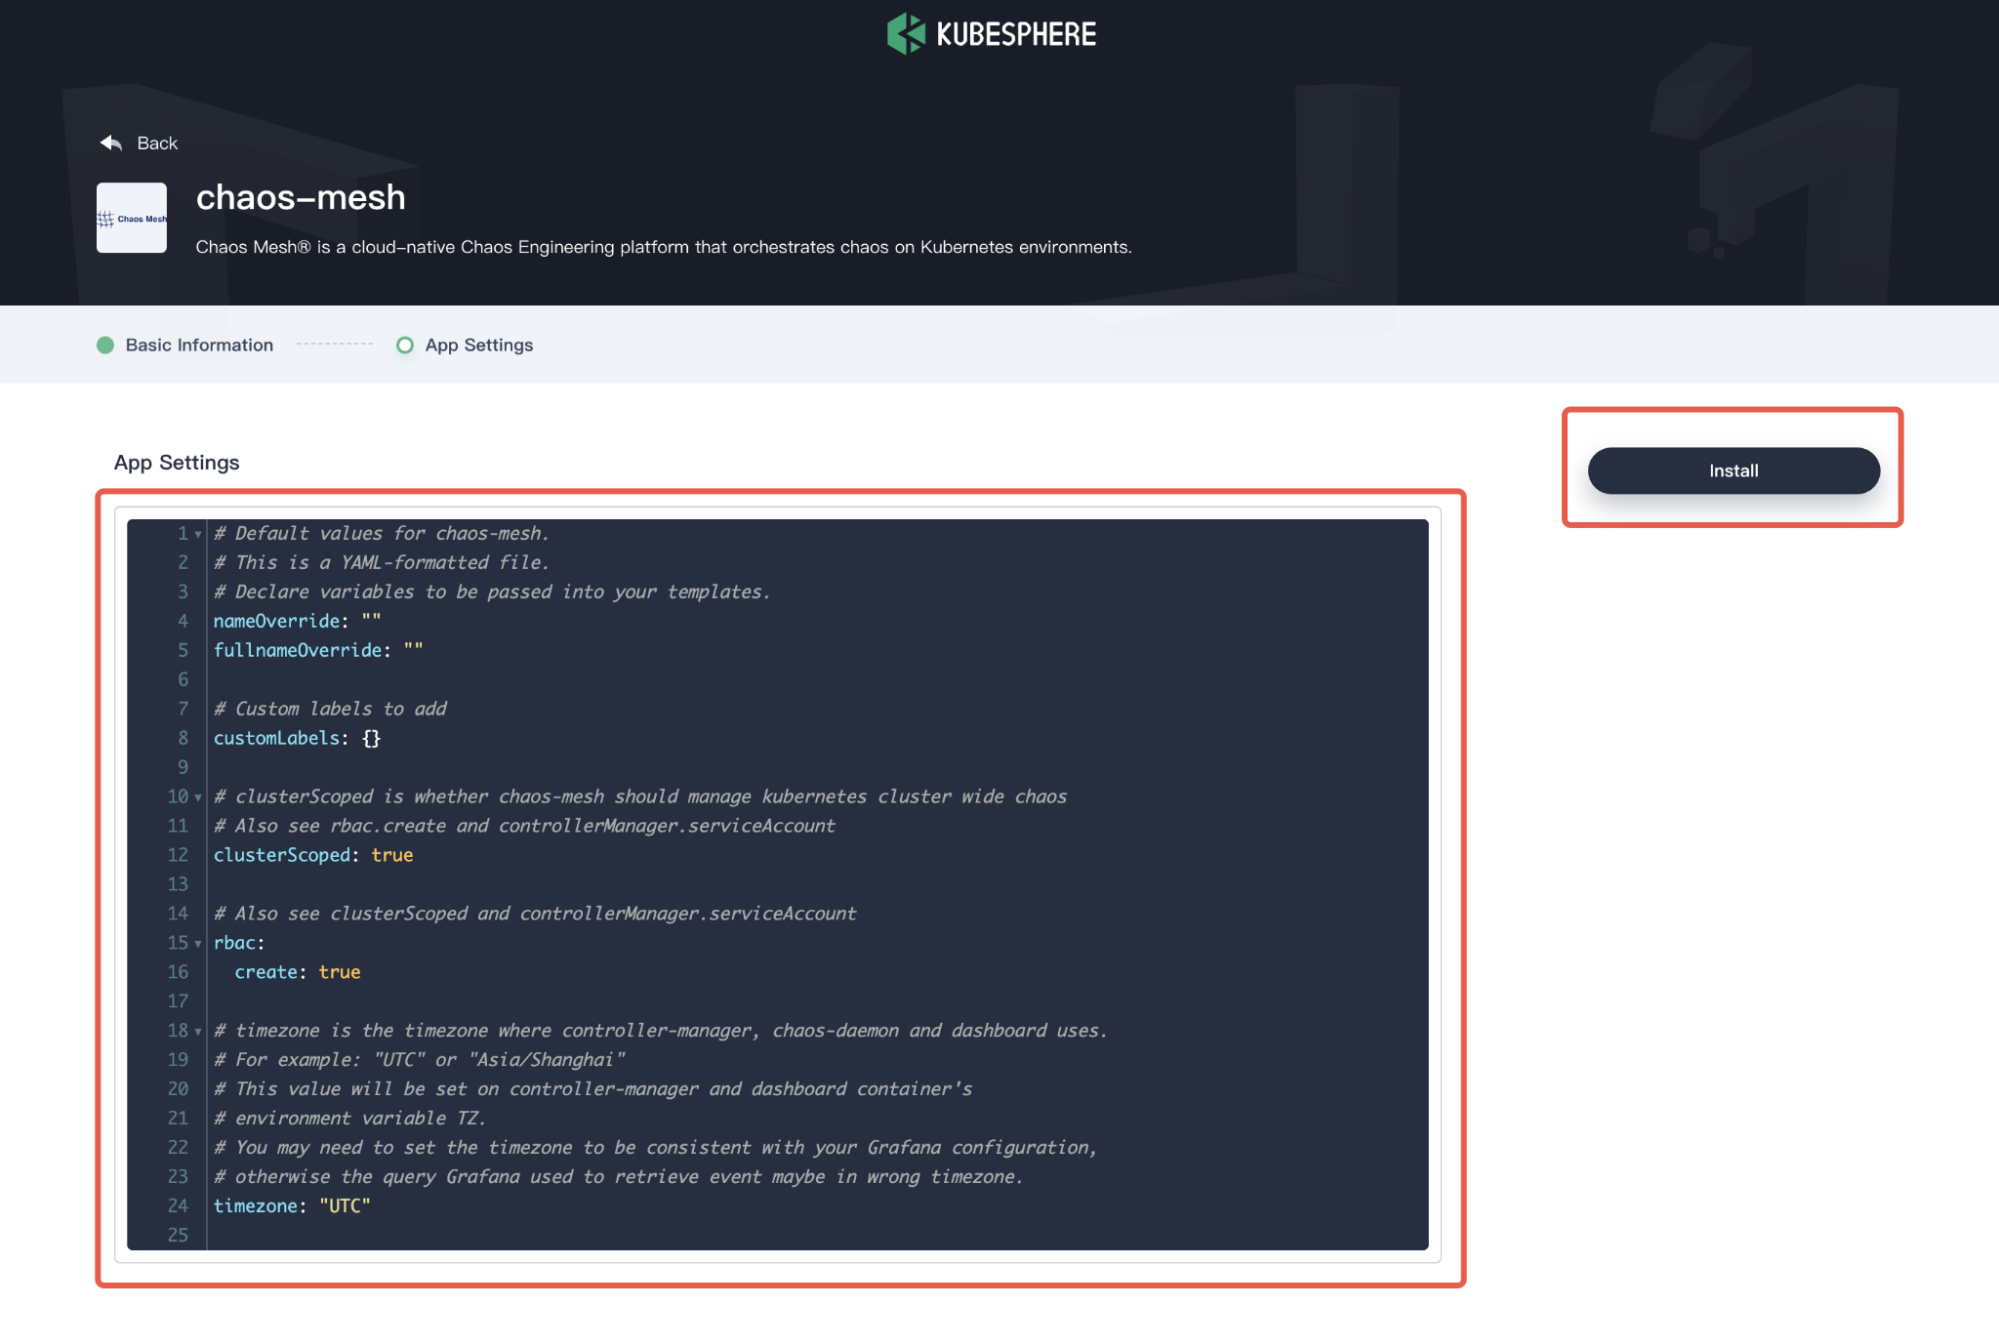
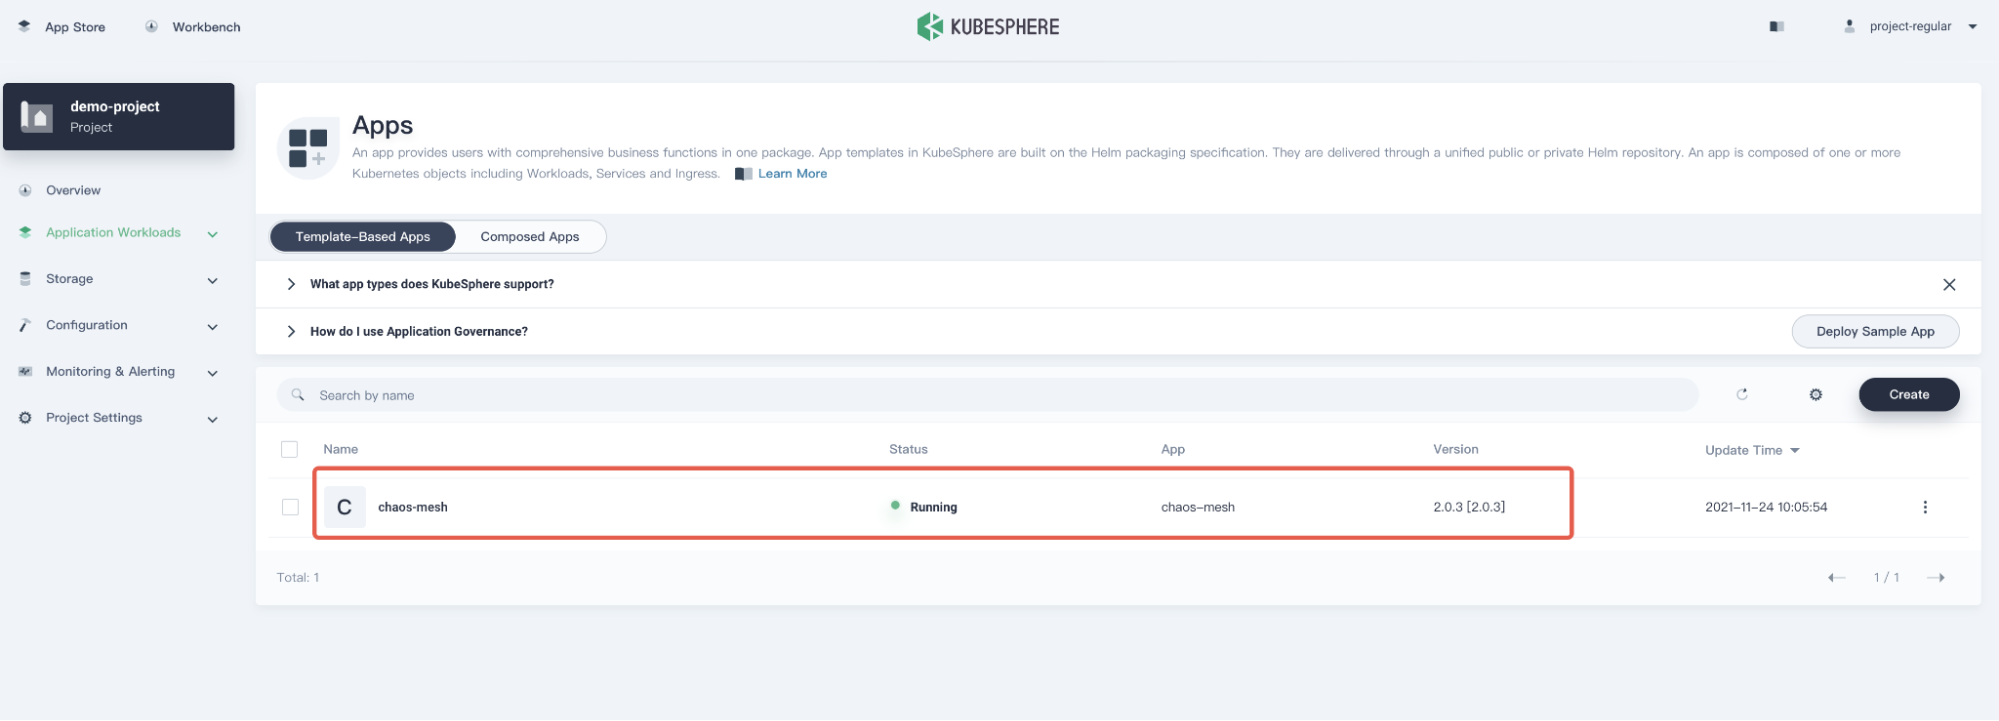
Wait for the deployment to be finished. Upon completion, Chaos Mesh will be shown as Running in KubeSphere.
Step 2: Visit Chaos Dashboard
In the Resource Status page, copy the **NodePort **of
chaos-dashboard.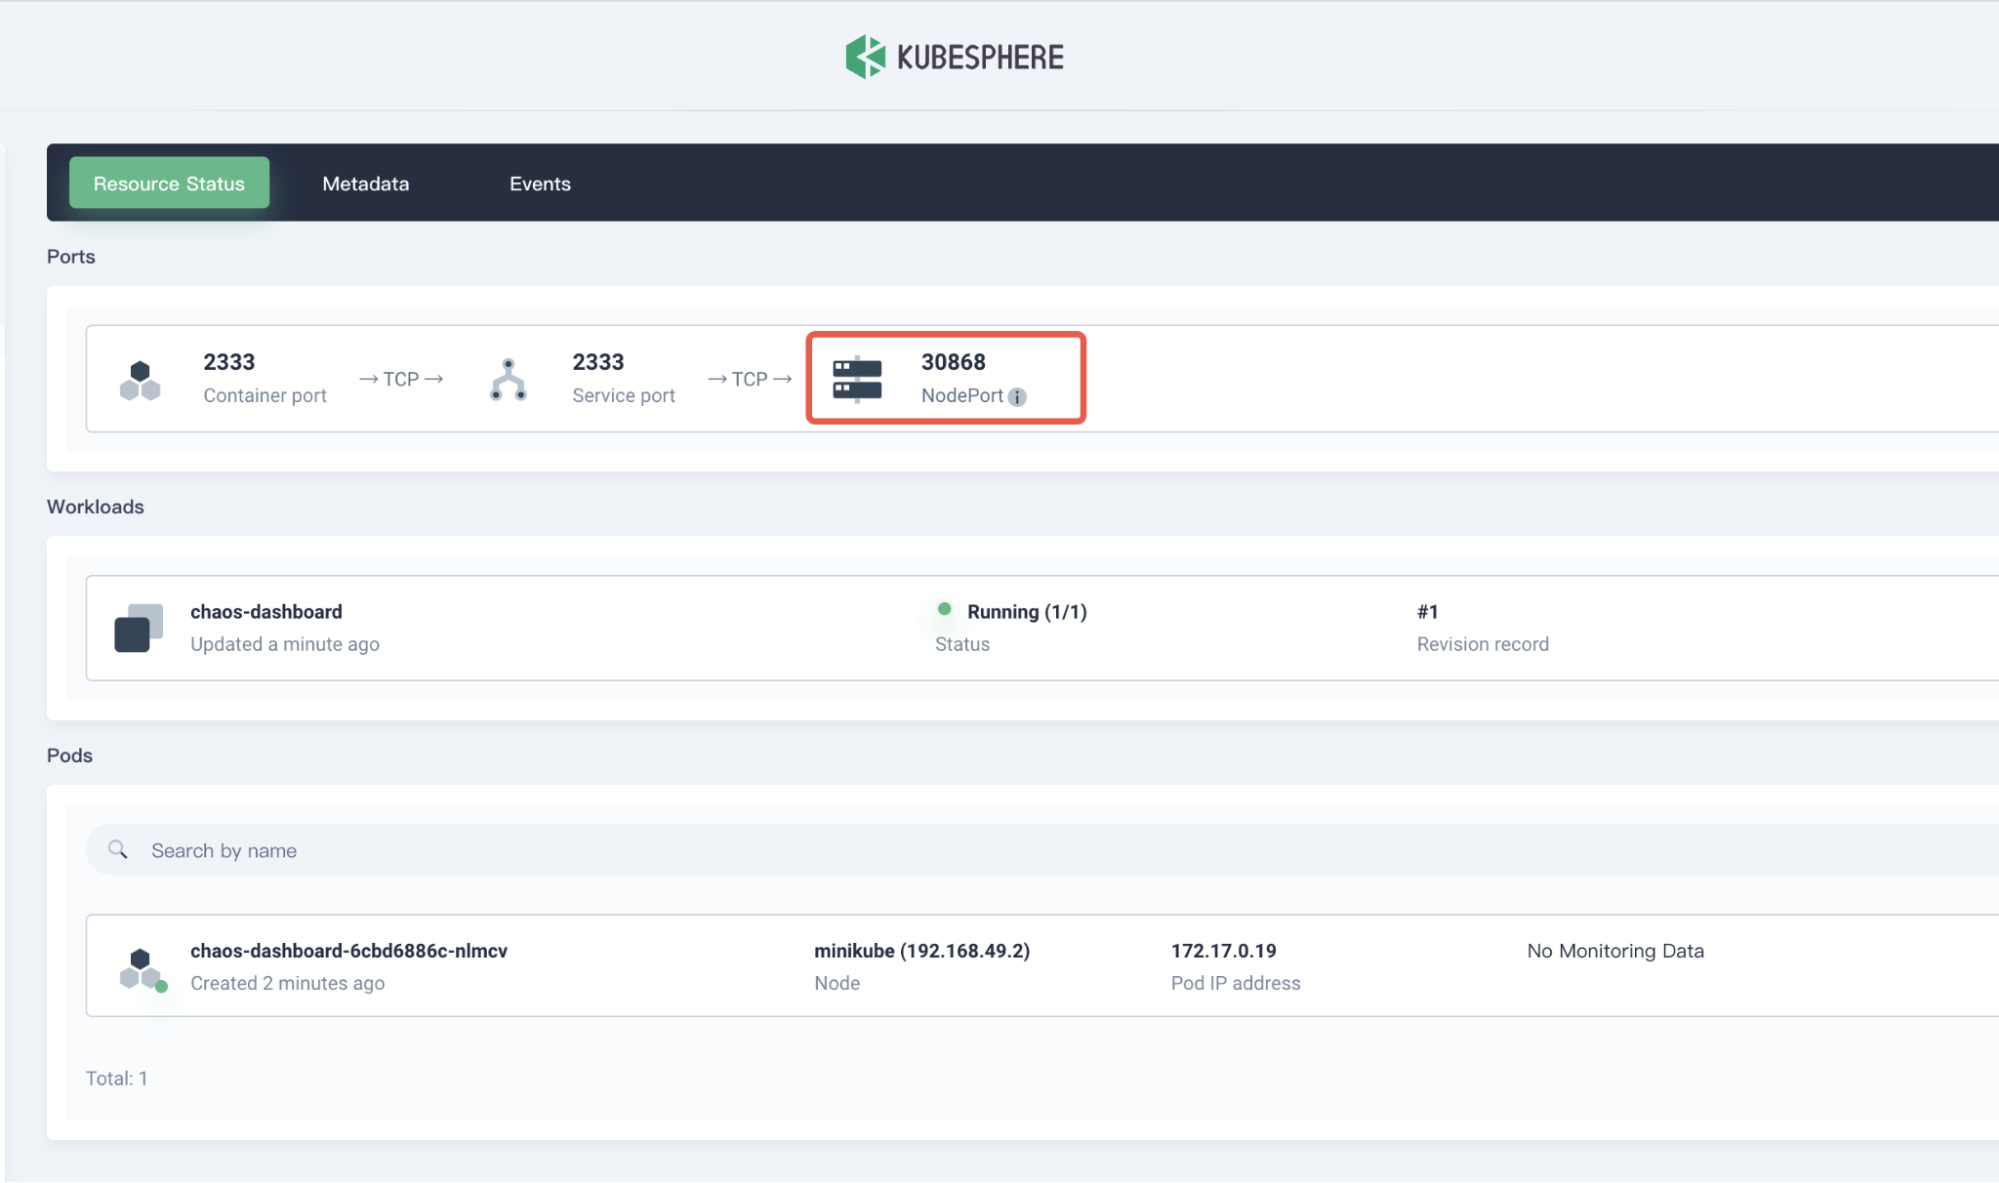
Access the Chaos Dashboard by entering
${NodeIP}:${NODEPORT}in your browser. Refer to Manage User Permissions to generate a Token and log into Chaos Dashboard.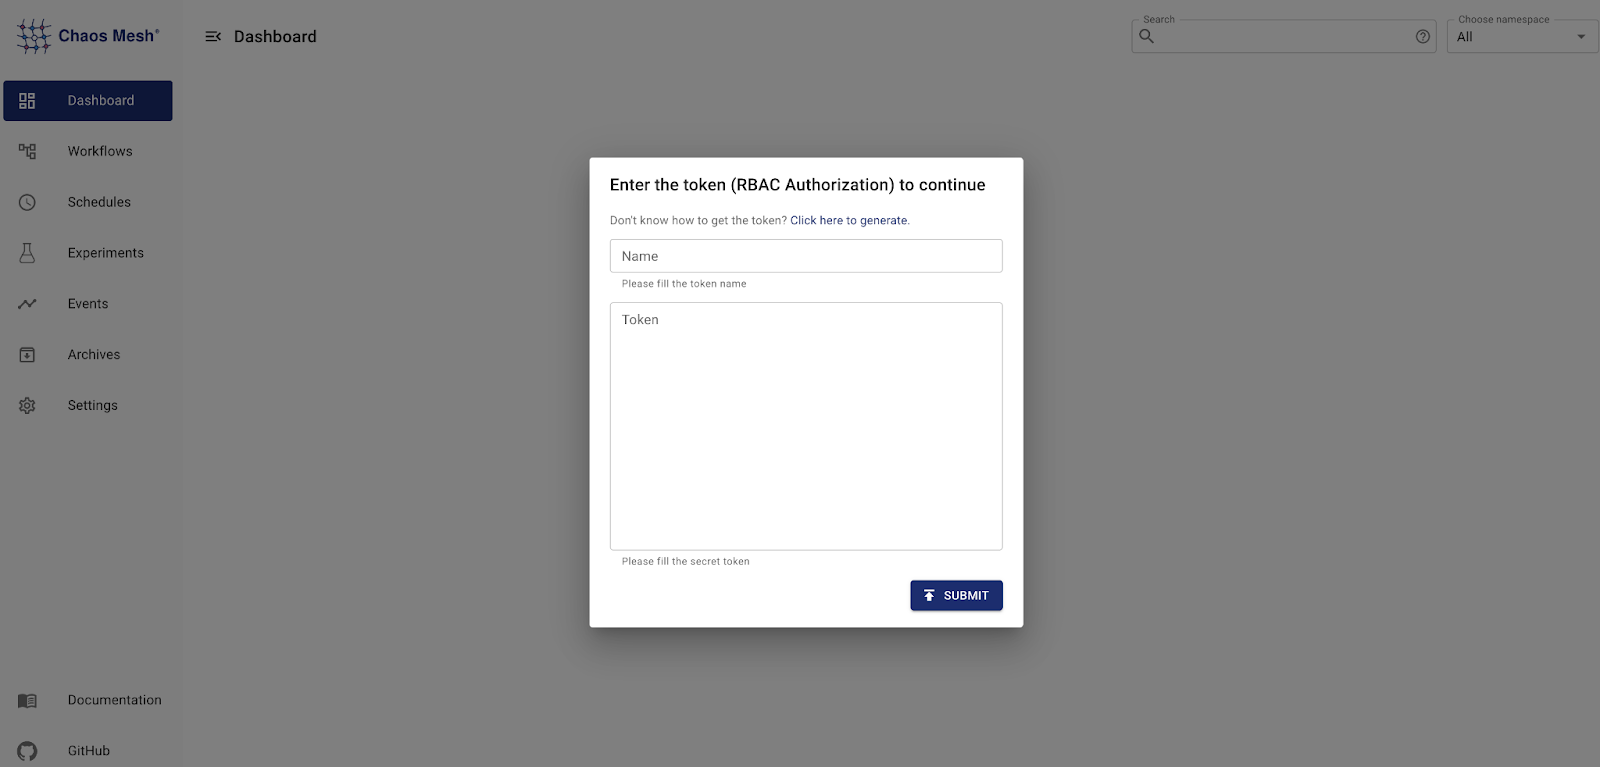
Step 3: Create a chaos experiment
Before creating a chaos experiment, you should identify and deploy your experiment target, for example, to test how an application works under network latency. Here, we use a demo application web-show as the target application to be tested, and the test goal is to observe the system network latency. You can deploy a demo application web-show with the following command: web-show.
curl -sSL https://mirrors.chaos-mesh.org/latest/web-show/deploy.sh | bash
Note: The network latency of the Pod can be observed directly from the web-show application pad to the kube-system pod.
From your web browser, visit ${NodeIP}:8081 to access the Web Show application.
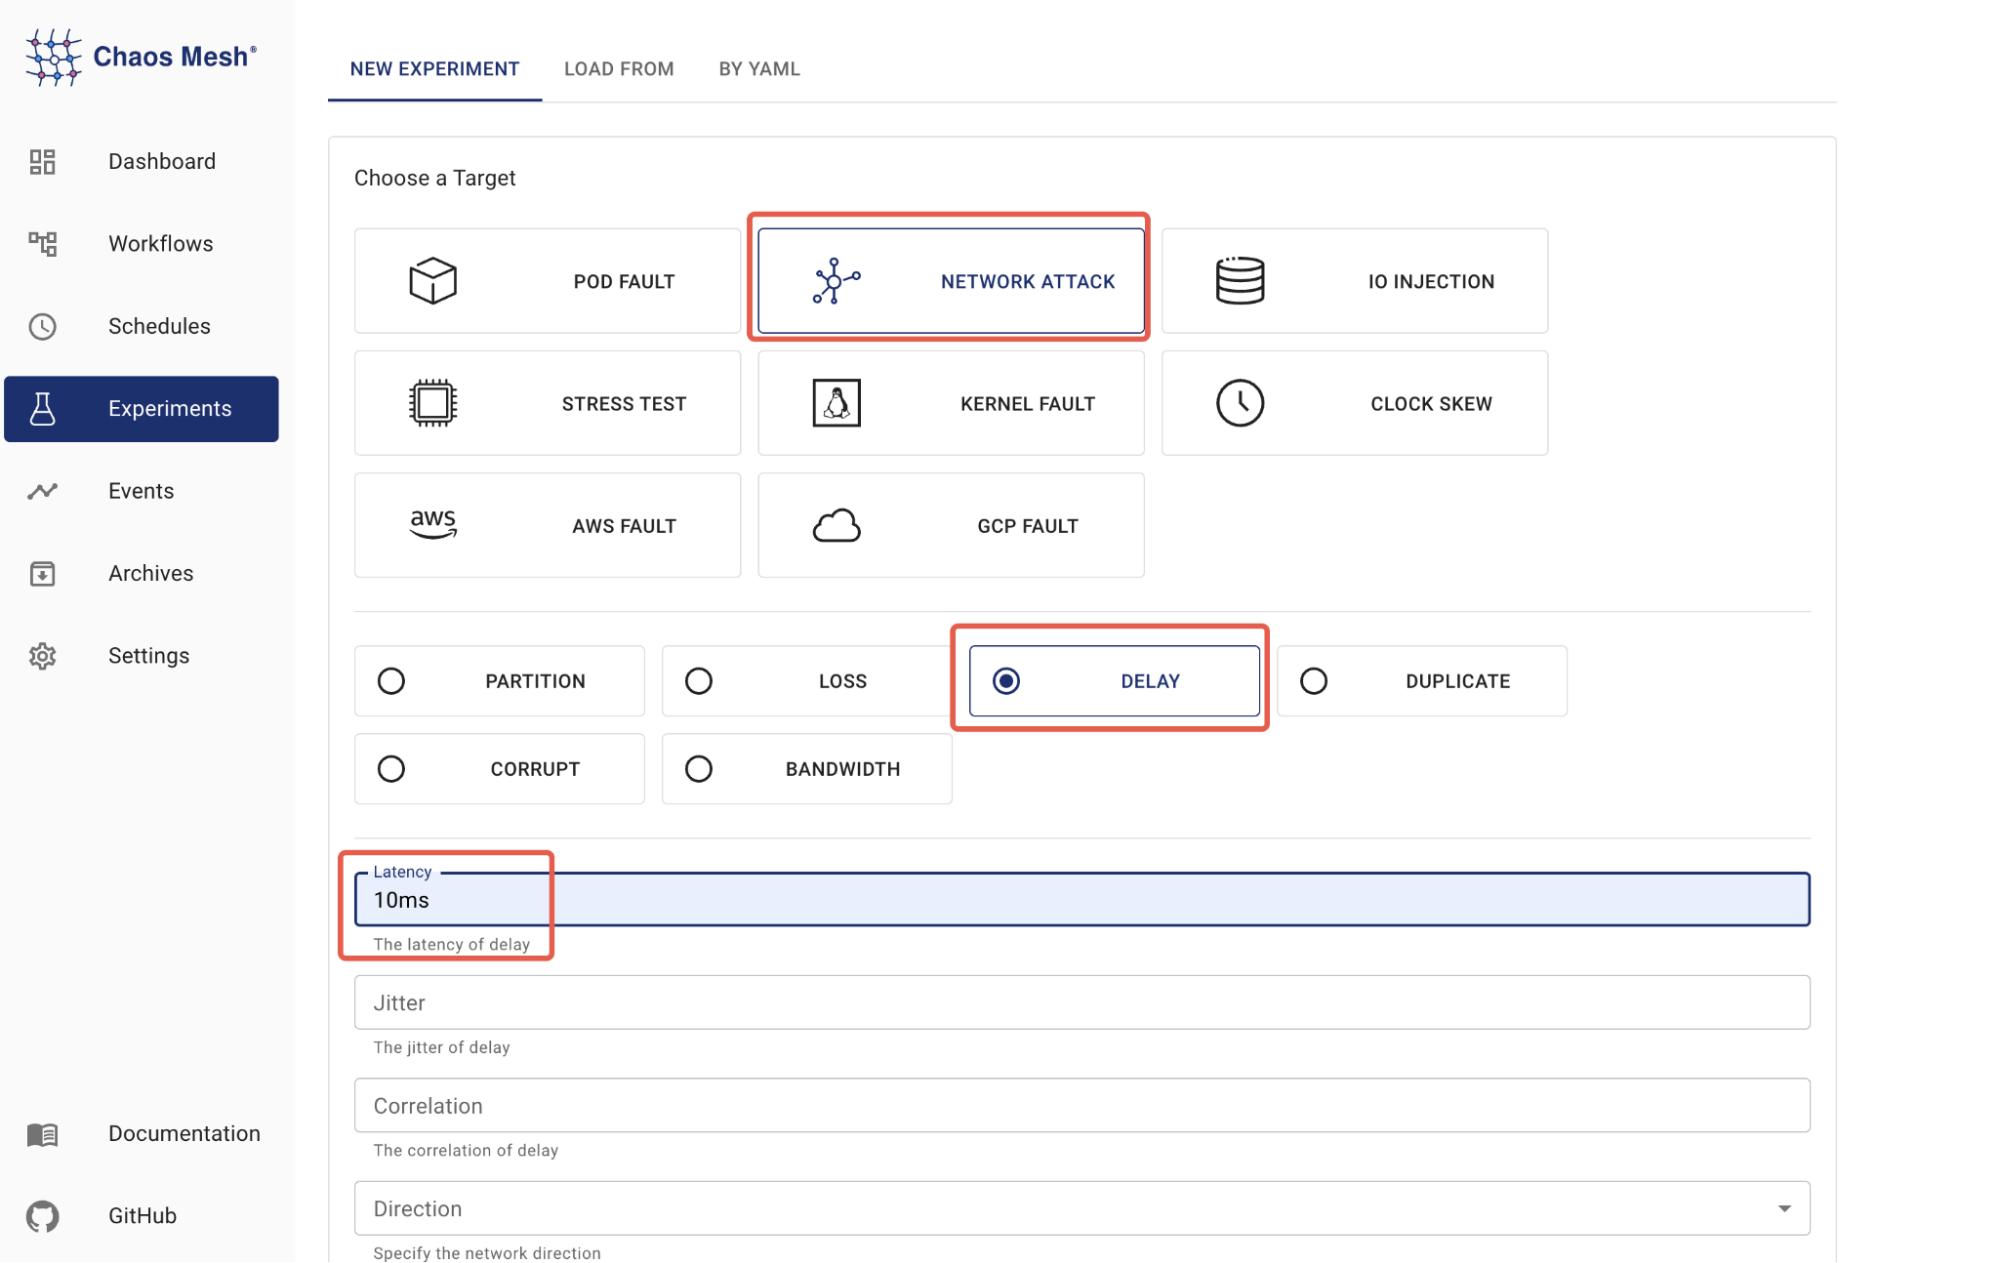
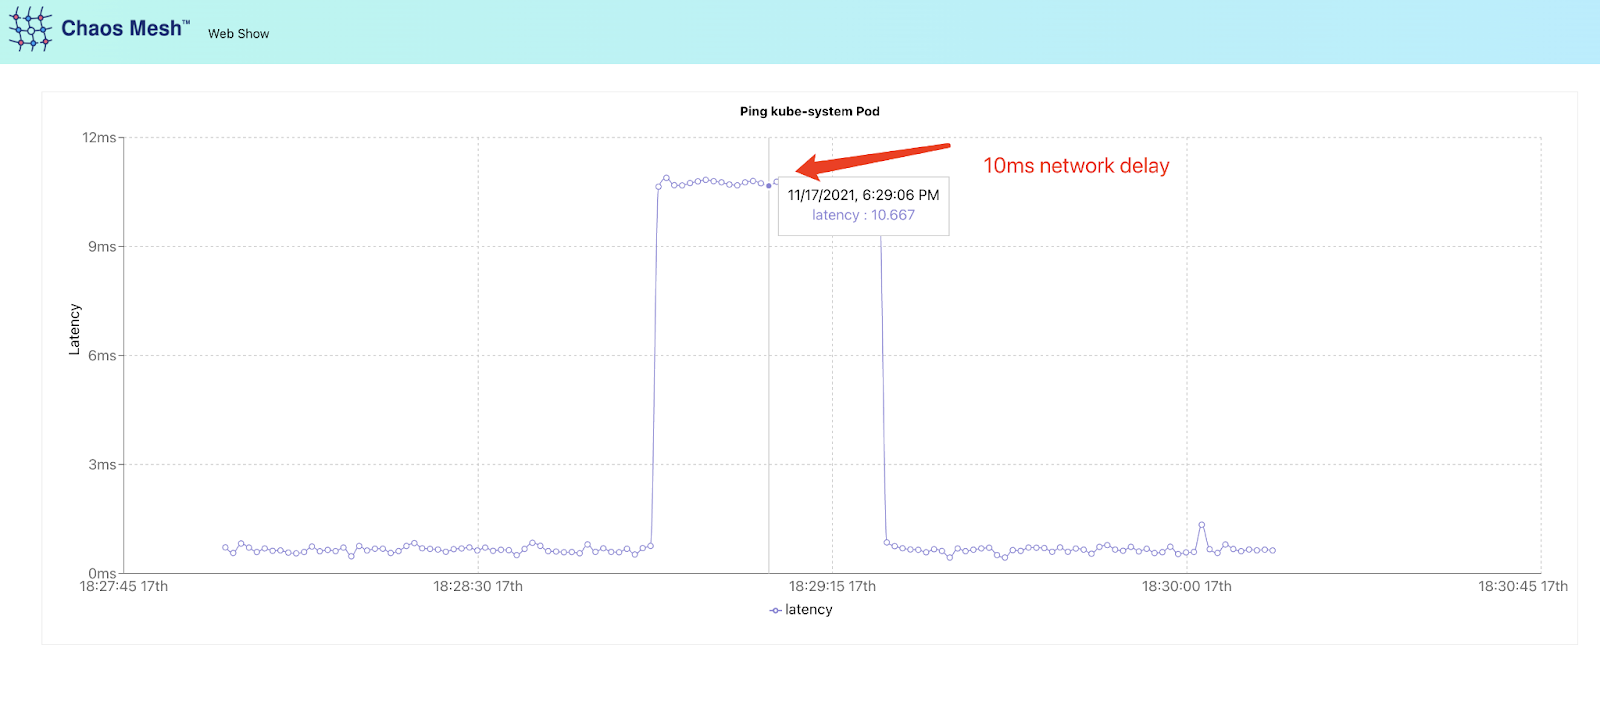
Log in to Chaos Dashboard to create a chaos experiment. To observe the effect of network latency on the application, we set the **Target **as "Network Attack" to simulate a network delay scenario.
The Scope of the experiment is set to
app: web-show.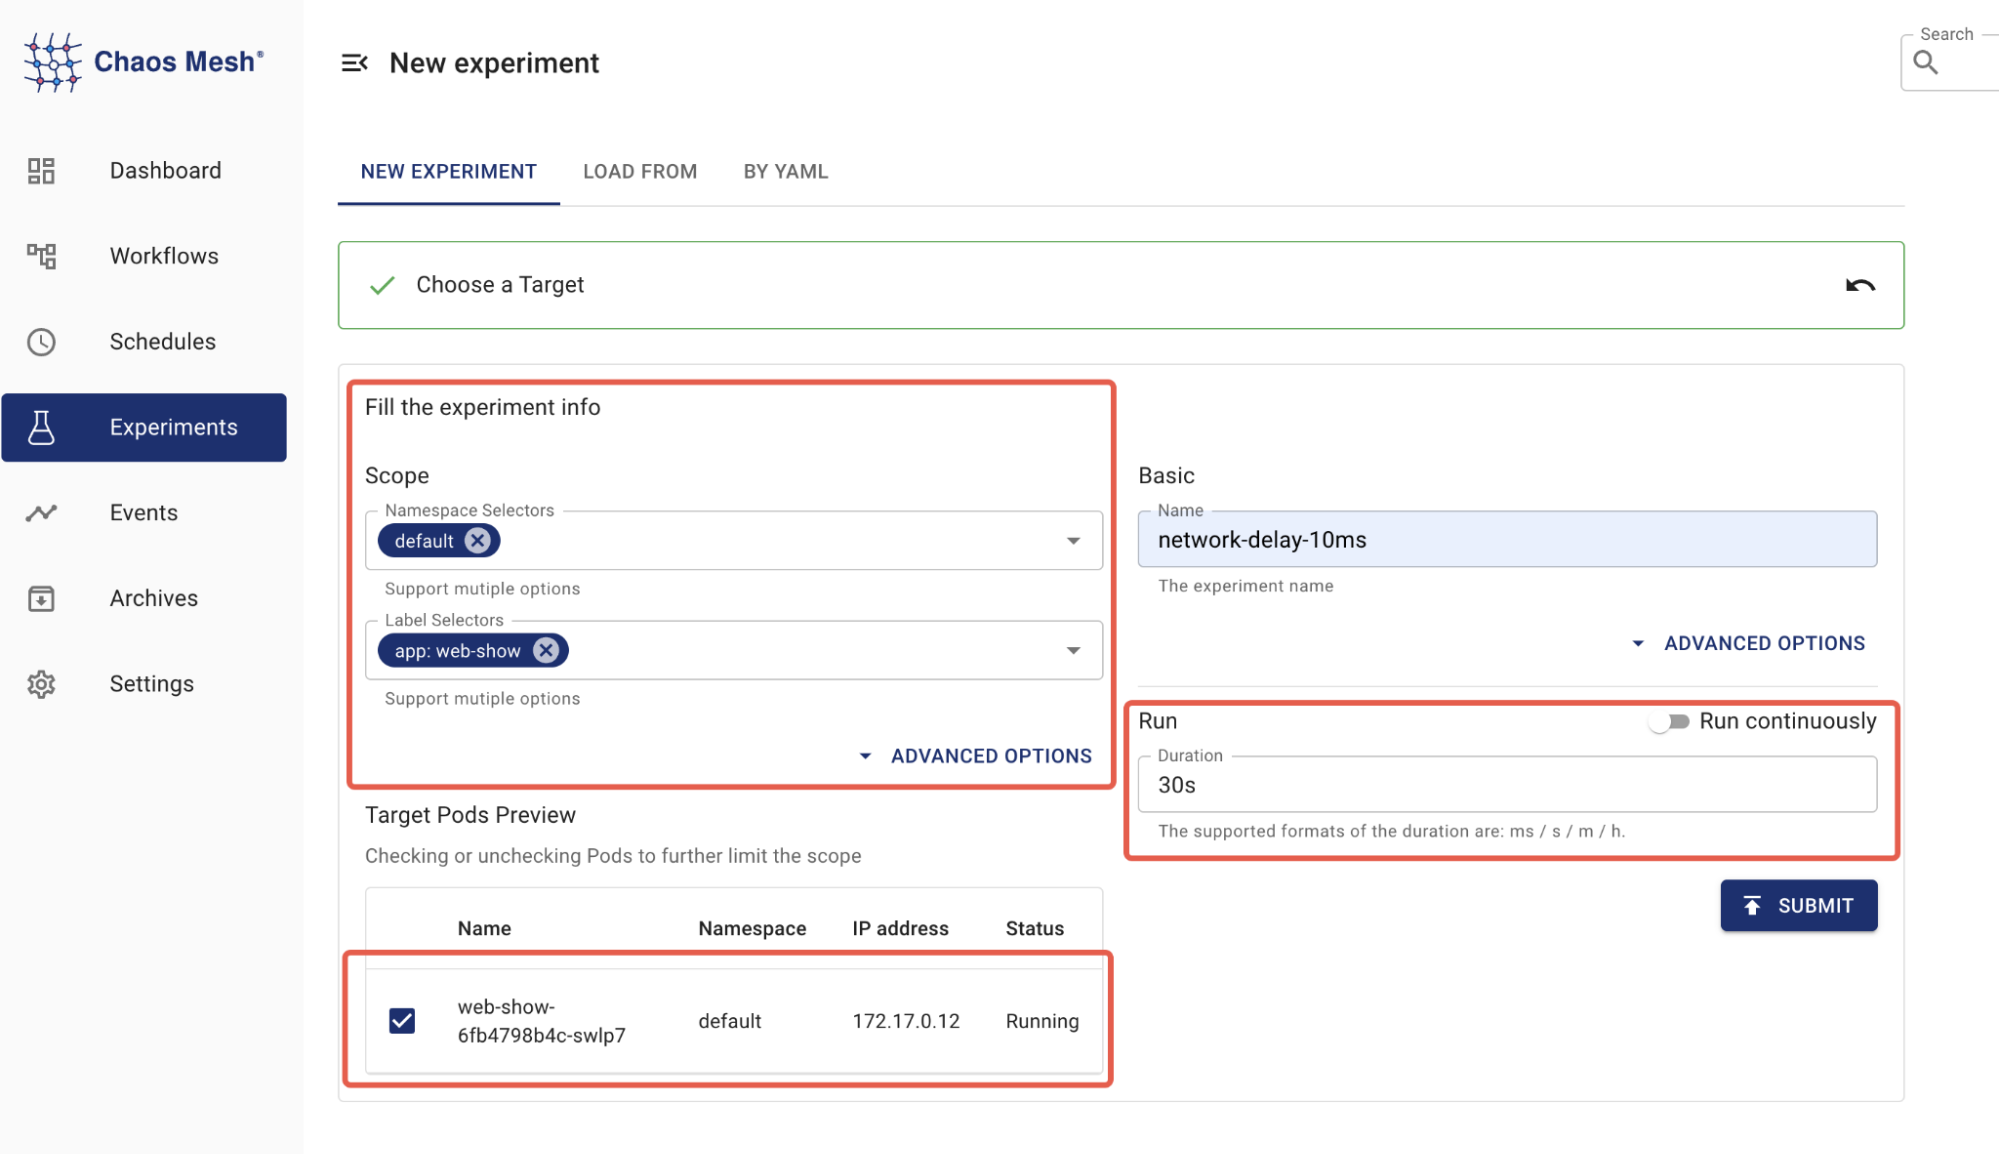
Start the chaos experiment by submitting it.
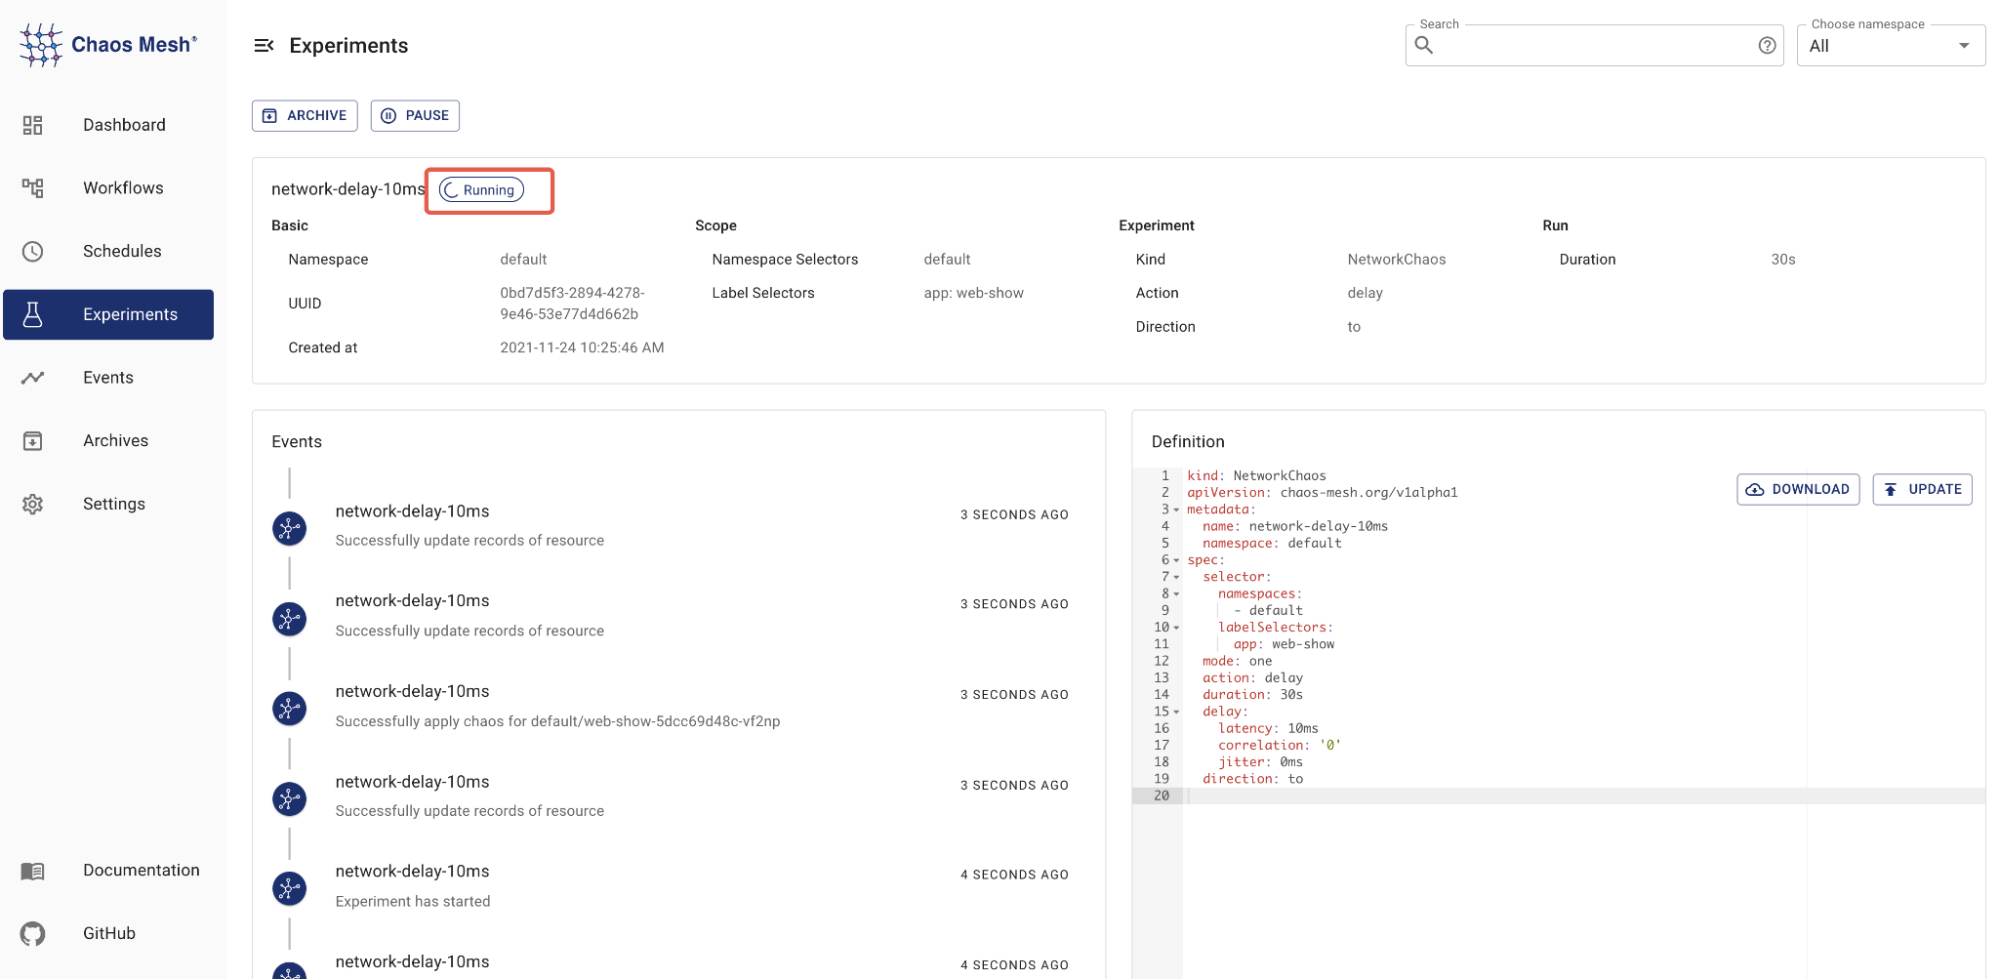
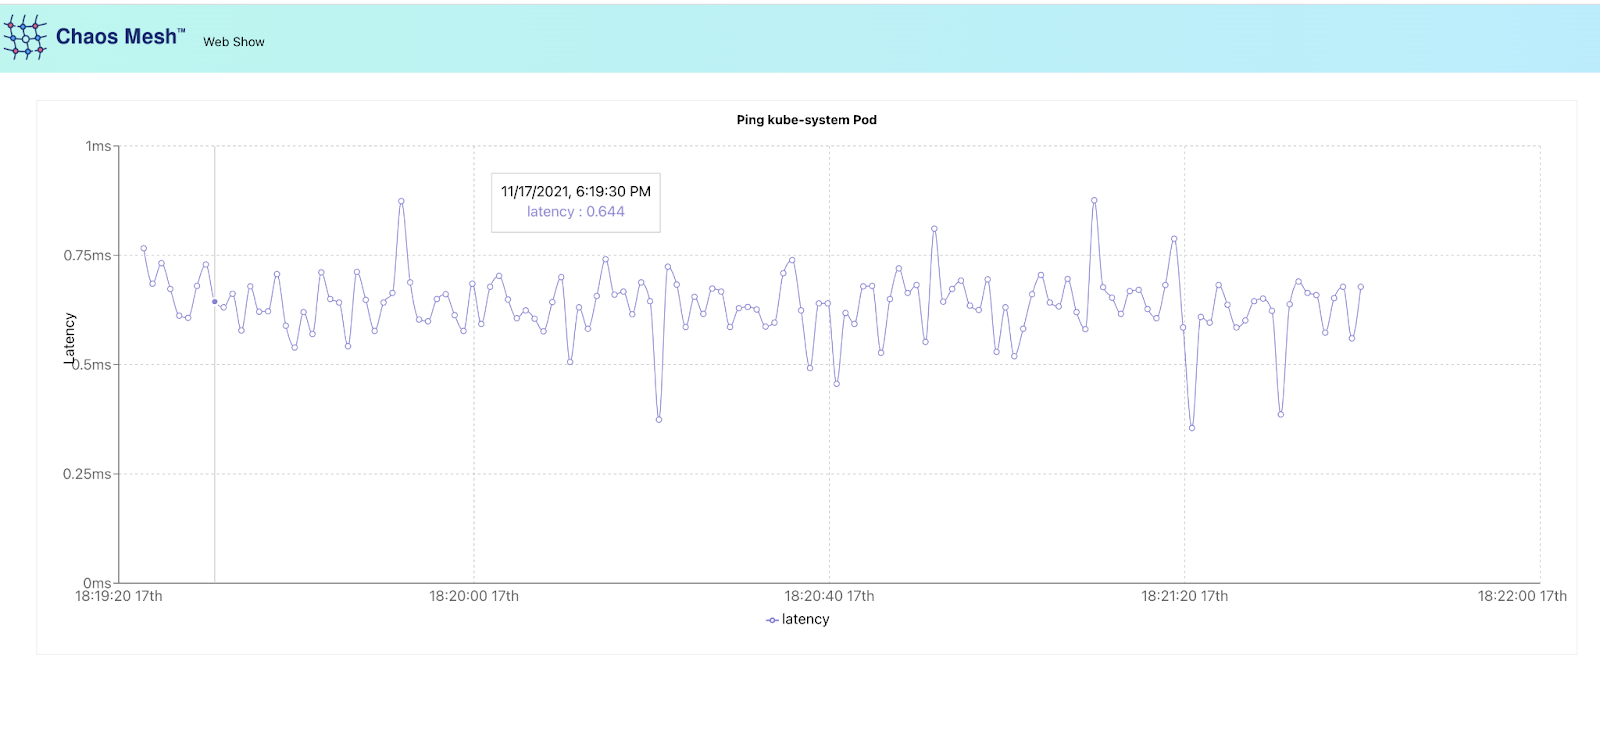
Now, you should be able to visit Web Show to observe experiment results:
Feedback
Was this page Helpful?
Receive the latest news, articles and updates from KubeSphere
Thanks for the feedback. If you have a specific question about how to use KubeSphere, ask it on Slack. Open an issue in the GitHub repo if you want to report a problem or suggest an improvement.


 Previous
