


KubeSphere Log Dashboard
As an open-source, application-centric container platform, KubeSphere v3.4.1 uses OpenSearch instead of ElasticSearch as the backend storage for logs, events, and auditing. By default, we can use the query tool provided in the lower-right corner on the KubeSphere console to retrieve logs, events, and auditing records.
If you want an experience similar to the Kibana page, such as log chart drawing, you can enable OpenSearch Dashboard.
Enable Log Dashboard Before KubeSphere Installation
Install on Linux
When installing KubeSphere with multiple nodes on Linux, you should create a configuration file that lists all KubeSphere components.
When you Install KubeSphere on Linux, create a file
config-sample.yamland change it by executing the following command:vi config-sample.yamlBefore enabling the OpenSearch Dashboard, you need to enable components
logging,opensearch, andeventsorauditingin the yaml file. In this example, enableeventsas follows:opensearch: basicAuth: enabled: true password: admin username: admin dashboard: enabled: true # Change "false" to "true". enabled: true # Change "false" to "true". externalOpensearchHost: "" externalOpensearchPort: "" logMaxAge: 7 opensearchPrefix: whizardlogging: enabled: true # Change "false" to "true". logsidecar: enabled: true replicas: 2events: enabled: true # Change "false" to "true". ruler: enabled: true replicas: 2Execute the following command to create the cluster using this configuration file:
./kk create cluster -f config-sample.yaml
Install on Kubernetes
When you Install KubeSphere on Kubernetes, you need to enable the relevant components in the cluster-configuration.yaml file.
Download the cluster-configuration.yaml file and edit the file using the following command:
vi cluster-configuration.yamlBefore enabling the OpenSearch Dashboard, you need to enable components
logging,opensearch, andeventsorauditingin the yaml file. In this example, enableeventsas follows:opensearch: basicAuth: enabled: true password: admin username: admin dashboard: enabled: true # Change "false" to "true". enabled: true # Change "false" to "true". externalOpensearchHost: "" externalOpensearchPort: "" logMaxAge: 7 opensearchPrefix: whizardlogging: enabled: true # Change "false" to "true". logsidecar: enabled: true replicas: 2events: enabled: true # Change "false" to "true". ruler: enabled: true replicas: 2Execute the following command to start KubeSphere installation:
kubectl apply -f https://github.com/kubesphere/ks-installer/releases/download/v3.4.1/kubesphere-installer.yaml kubectl apply -f cluster-configuration.yaml
Enable Log Dashboard After KubeSphere Installation
Log in to the console as the
adminuser, click Platform in the upper left corner, and select Cluster Management.Click CRDs, enter
clusterconfigurationin the search bar, and click the search result to view its detailed page.Info
Custom Resource Definitions (CRDs) allow users to create a new resource type without adding an additional API server. Users can use these custom resources just like other native Kubernetes objects.Under Custom Resources, click the three dots on the right side of
ks-installer, select Edit YAML.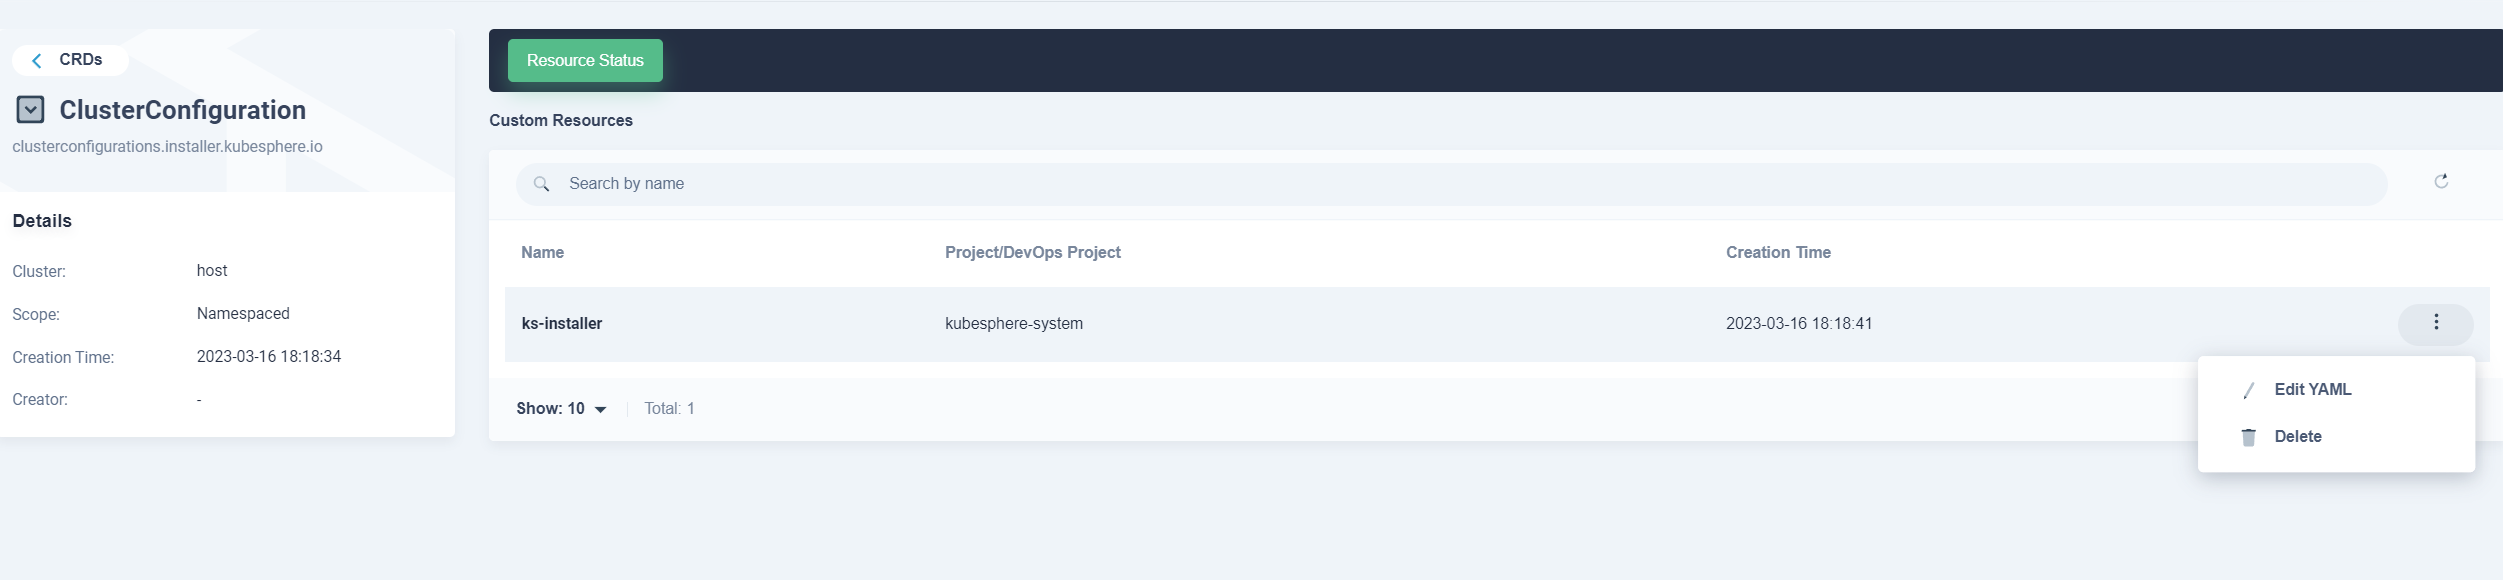
In the YAML file, edit as follows, and then click OK to save the configuration.
opensearch: basicAuth: enabled: true password: admin username: admin dashboard: enabled: true # Change "false" to "true". enabled: true # Change "false" to "true". externalOpensearchHost: "" externalOpensearchPort: "" logMaxAge: 7 opensearchPrefix: whizardlogging: enabled: true # Change "false" to "true". logsidecar: enabled: true replicas: 2events: enabled: true # Change "false" to "true". ruler: enabled: true replicas: 2Check the installation process in kubectl by executing the following command:
kubectl logs -n kubesphere-system $(kubectl get pod -n kubesphere-system -l 'app in (ks-install, ks-installer)' -o jsonpath='{.items[0].metadata.name}') -fNote
You can find the kubectl tool by clicking on the lower-right corner of the console.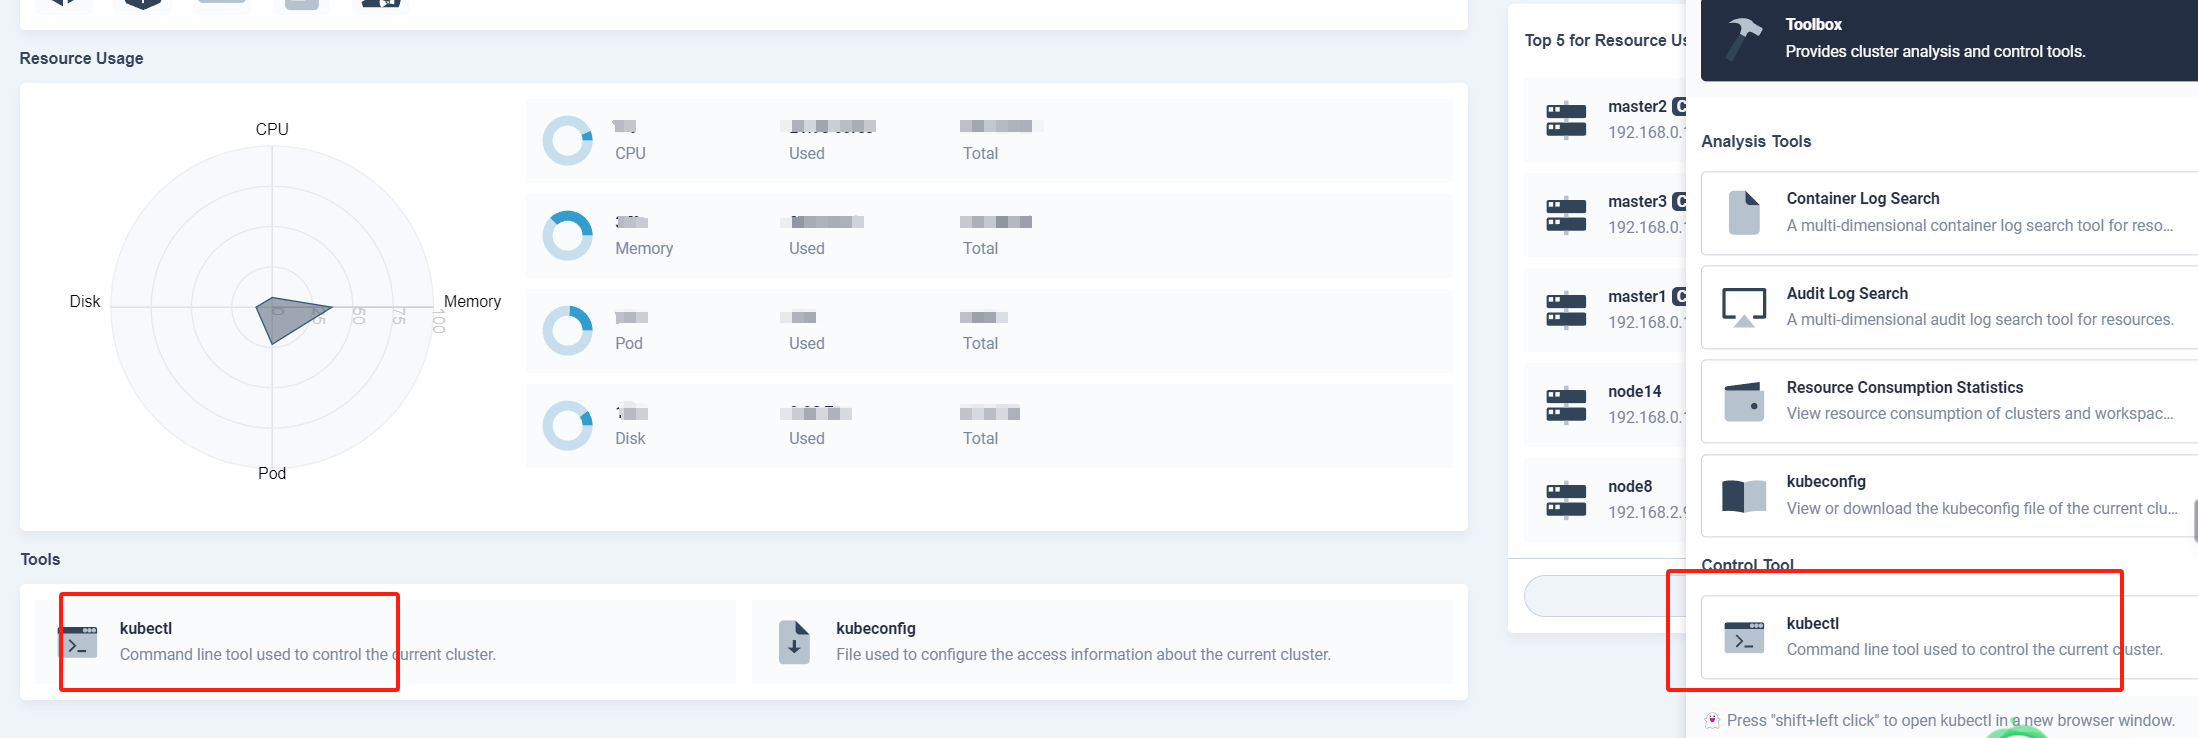
Access Log Dashboard
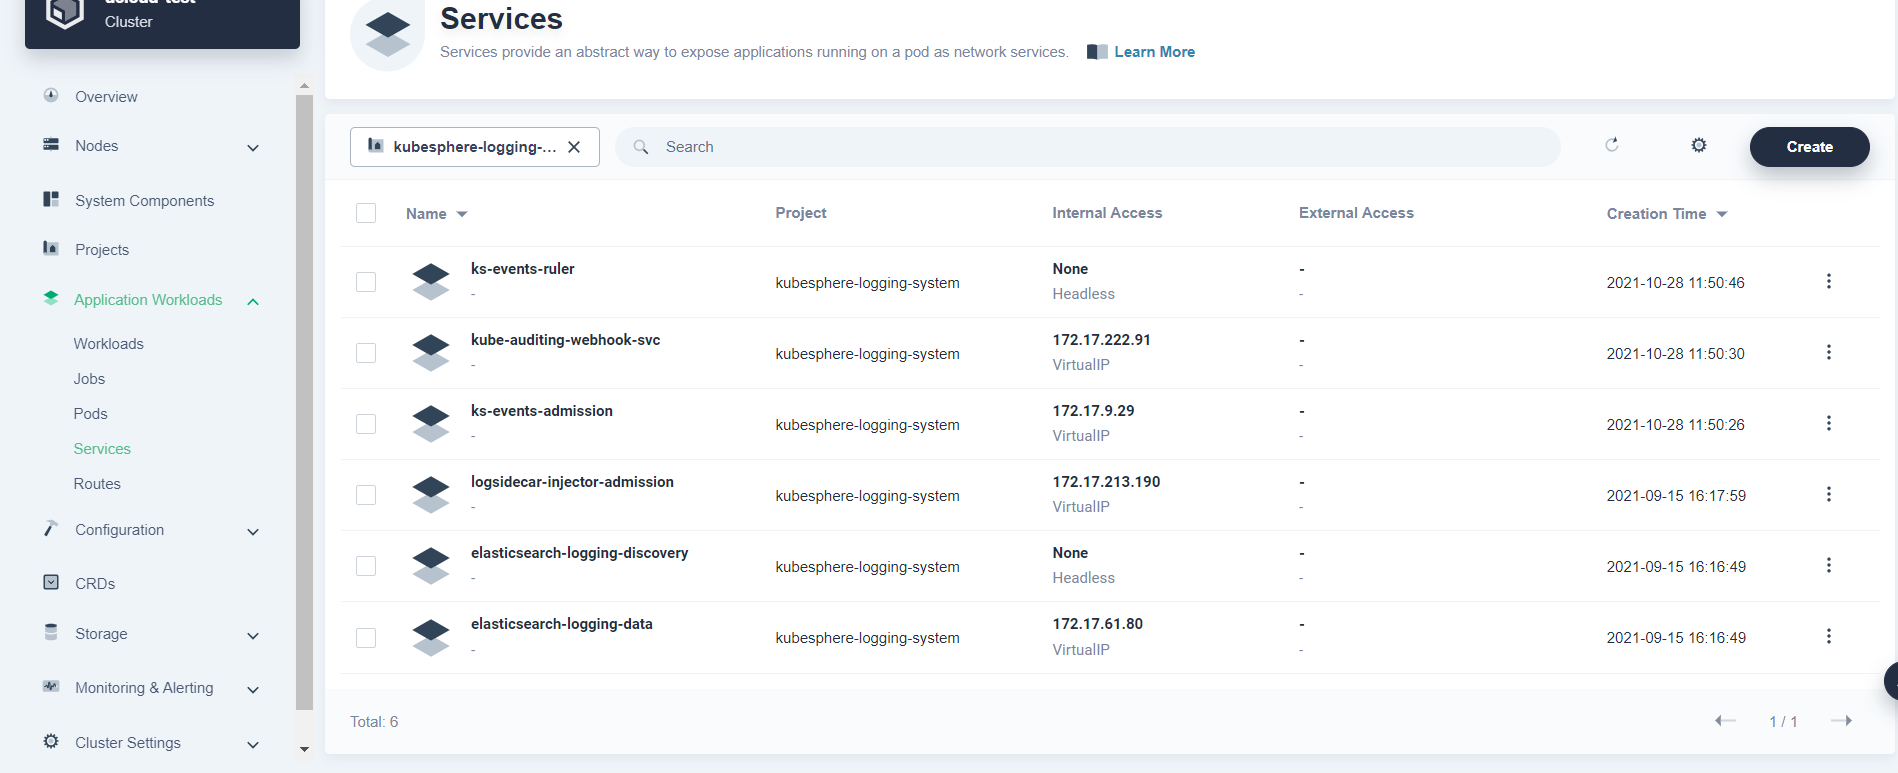
After logging in to the console, expose the 5601 port of the OpenSearch dashboard through NodePort or other forms such as Ingress to an accessible network as below.
Feedback
Was this page Helpful?
Receive the latest news, articles and updates from KubeSphere
Thanks for the feedback. If you have a specific question about how to use KubeSphere, ask it on Slack. Open an issue in the GitHub repo if you want to report a problem or suggest an improvement.
 Previous

What’s on this Page