View Built-in Dashboards
The Grafana for WhizardTelemetry extension comes with multiple Grafana Dashboards that allow direct querying of monitoring data for Kubernetes without the need for manual configuration of Grafana Dashboards.
Steps
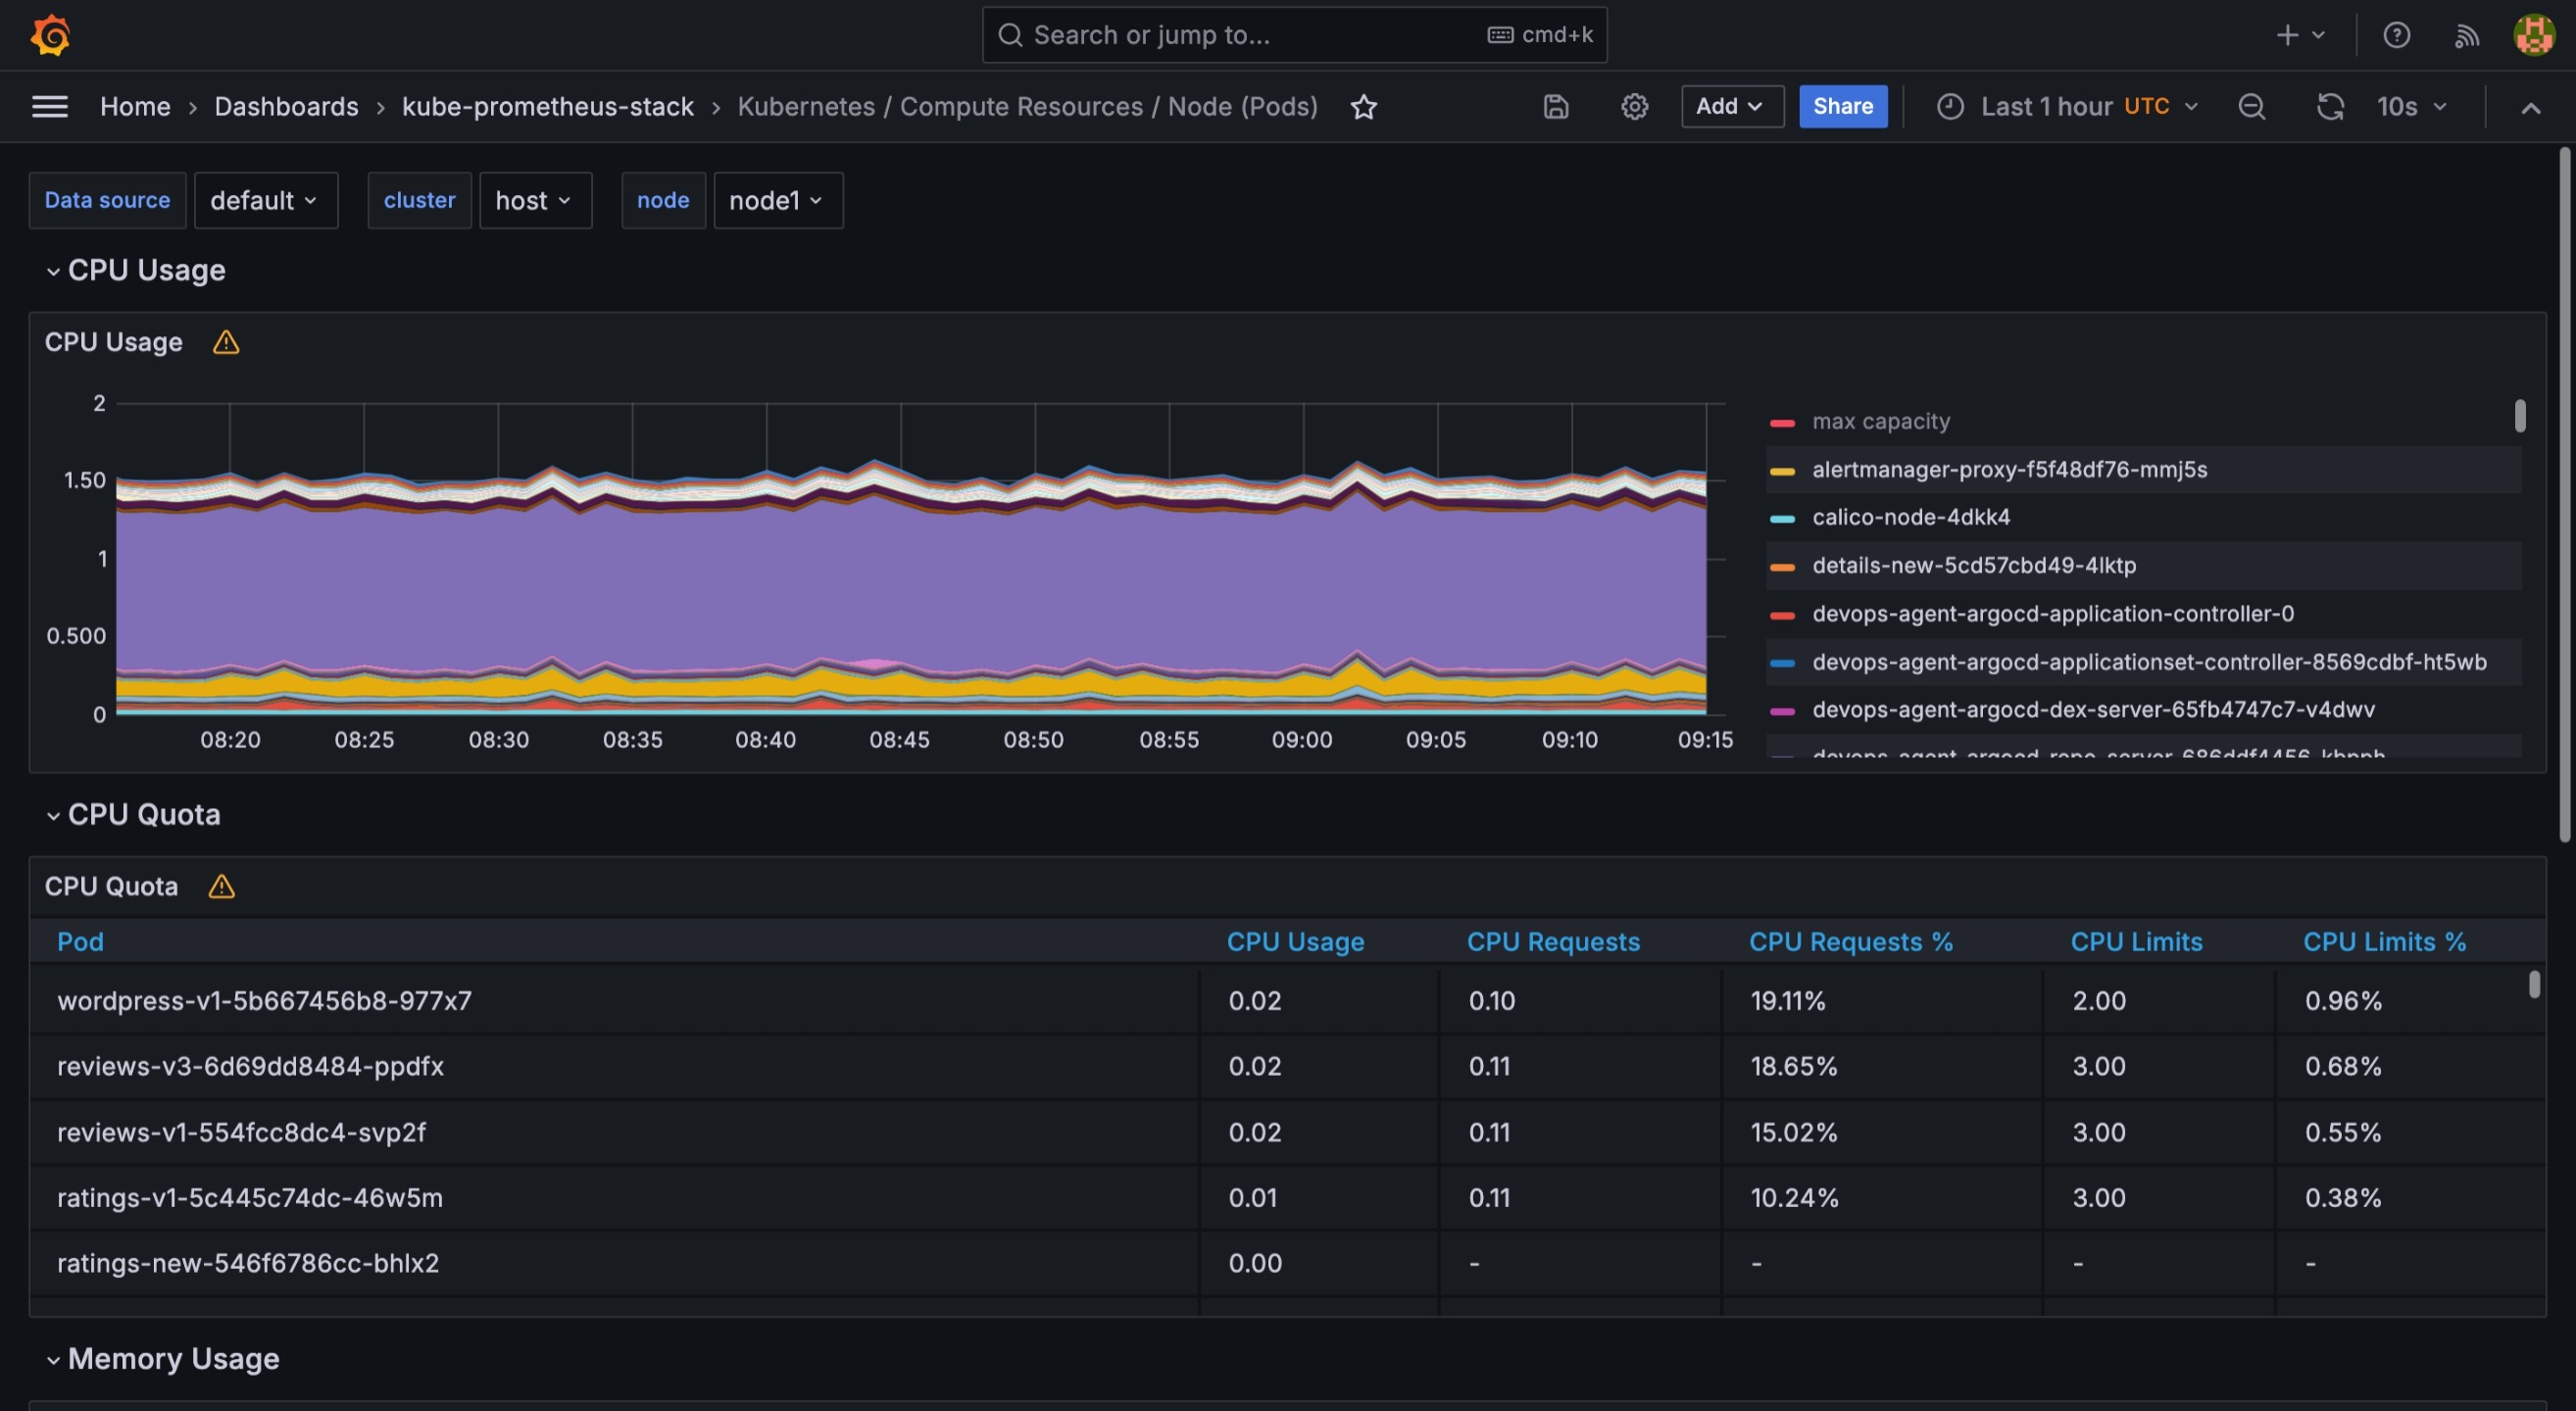
After logging into the Grafana console, click Dashboards in the left navigation pane to view all built-in Dashboard templates.
Directory Description kube-prometheus-stack
Visualizes monitoring data for Kubernetes.
Attention After installing the WhizardTelemetry Monitoring extension, the Dashboards in kube-prometheus-stack will display monitoring data.
Click on a Dashboard template in the directory to view the corresponding monitoring data.

Click data source, cluster, and node at the top to select data from specified sources, clusters, and nodes.
Click
 in the upper-right corner to set the time range for data display, supporting custom time periods.
Click
 in the upper-right corner to refresh the data on the dashboard. Click
 to set the interval for automatic data refresh.
Click
in the upper-right corner of each panel to independently view, edit, share, inspect, delete, etc., the specified panel.
Note For more information on Dashboards, see Grafana Documentation.
Feedback
Was this page Helpful?
Receive the latest news, articles and updates from KubeSphere
Thanks for the feedback. If you have a specific question about how to use KubeSphere, ask it on Slack. Open an issue in the GitHub repo if you want to report a problem or suggest an improvement.


 Previous
