Add Data Sources
This section briefly introduces how to add, configure, and query data sources. For more information, see Grafana data sources.
Before creating a Dashboard, you must first add a data source. The Grafana for WhizardTelemetry extension defaults to adding the Prometheus server address as a data source. You can also add data sources yourself, such as Loki, Elasticsearch, InfluxDB, PostgreSQL, MySQL, etc.
After adding a data source, you can:
Use Explore to query data.
Visualize data in panels.
Create alert rules.
Prerequisites
Only users with the admin role in the Grafana console can add or delete data sources.
Add Data Sources
After logging into the Grafana console, click Connections in the left navigation pane.
Search for the data source, such as
loki.Click the data source name to enter the data source overview page.
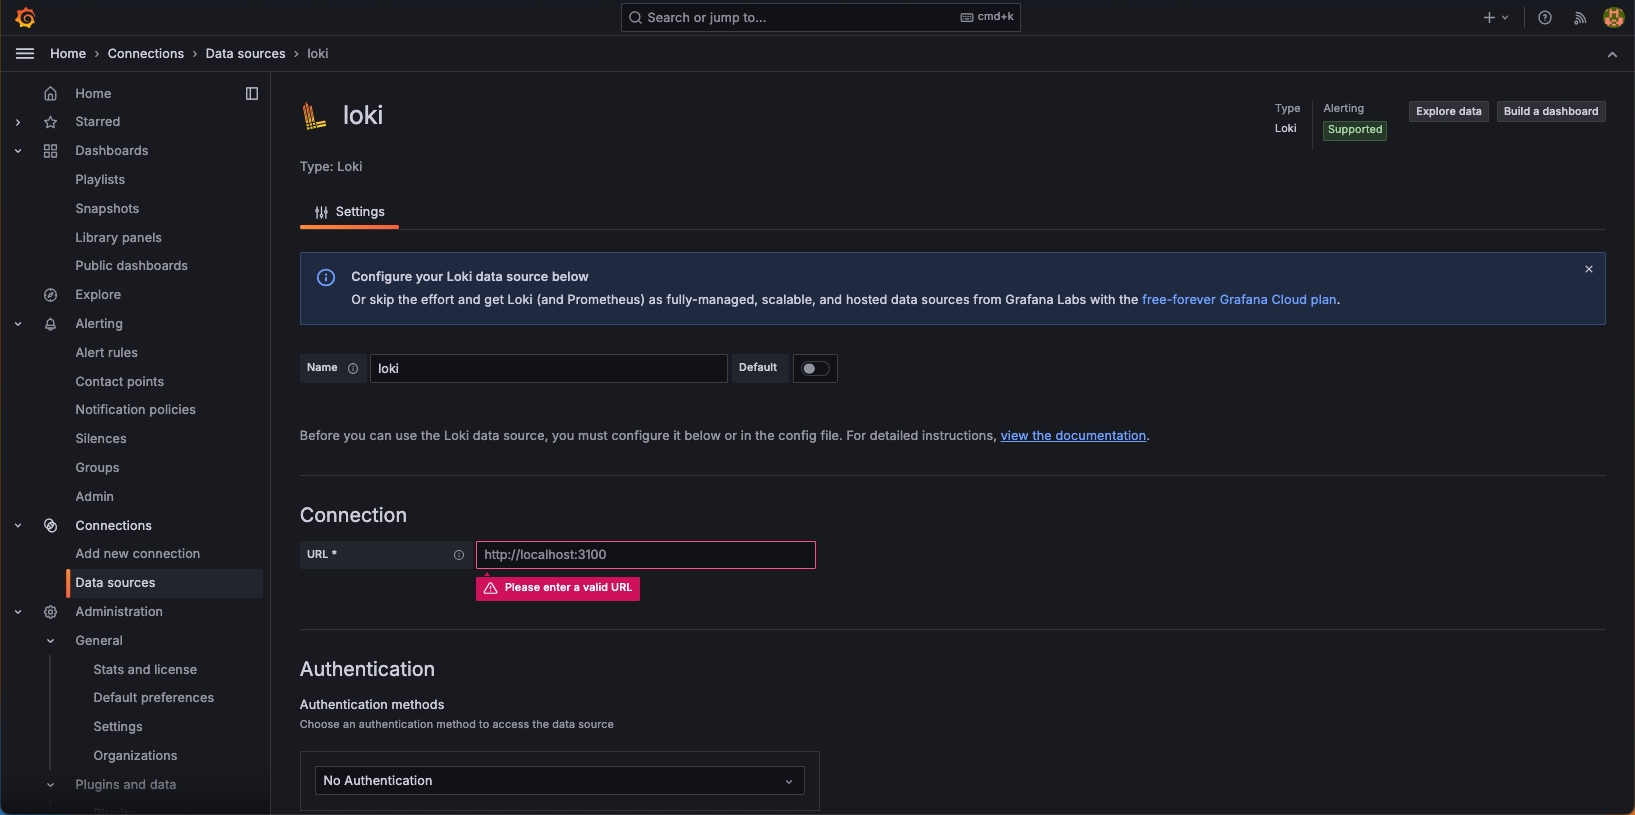
Click Add new data source in the upper-right corner to enter the data source configuration page.
Enter the server address of the data source, then click Save & test at the bottom to complete the configuration of the data source.

Query Data Source Data
Set query conditions to query data for specific metrics within a certain time range in the data source.
Click Explore in the left navigation pane, and select the data source at the top.
Enter or select Metric in the query editor, set Label filters, then click Run query in the upper-right corner.

Delete Data Sources
Click Connections > Data sources in the left navigation pane.
Click the name of the data source you want to delete to enter the data source configuration page.
Click Delete at the bottom to delete the data source.
Feedback
Was this page Helpful?
Receive the latest news, articles and updates from KubeSphere
Thanks for the feedback. If you have a specific question about how to use KubeSphere, ask it on Slack. Open an issue in the GitHub repo if you want to report a problem or suggest an improvement.


 Previous
