


Published on:2021-08-26
The number of views: 374


Serverless Use Case: Elastic Kubernetes Log Alerts with OpenFunction and Kafka
Overview
How do you handle container logs collected by the message server? You may face a dilemma: Deploying a dedicated log processing workload can be costly, and it is difficult to assess the number of standby log processing workloads required when the quantity of logs fluctuates sharply. This blog post offers ideas for serverless log processing, which reduces the link cost while improving flexibility.
Our general design idea is to add a Kafka server as a log receiver, and then use the log input to the Kafka server as an event to drive the serverless workloads to handle logs. Roughly, the following steps are involved:
- Set up a Kafka server as the log receiver for Kubernetes clusters.
- Deploy OpenFunction to provide serverless capabilities for log processing workloads.
- Write log processing functions to grab specific logs to generate alerting messages.
- Configure Notification Manager to send alerts to Slack.
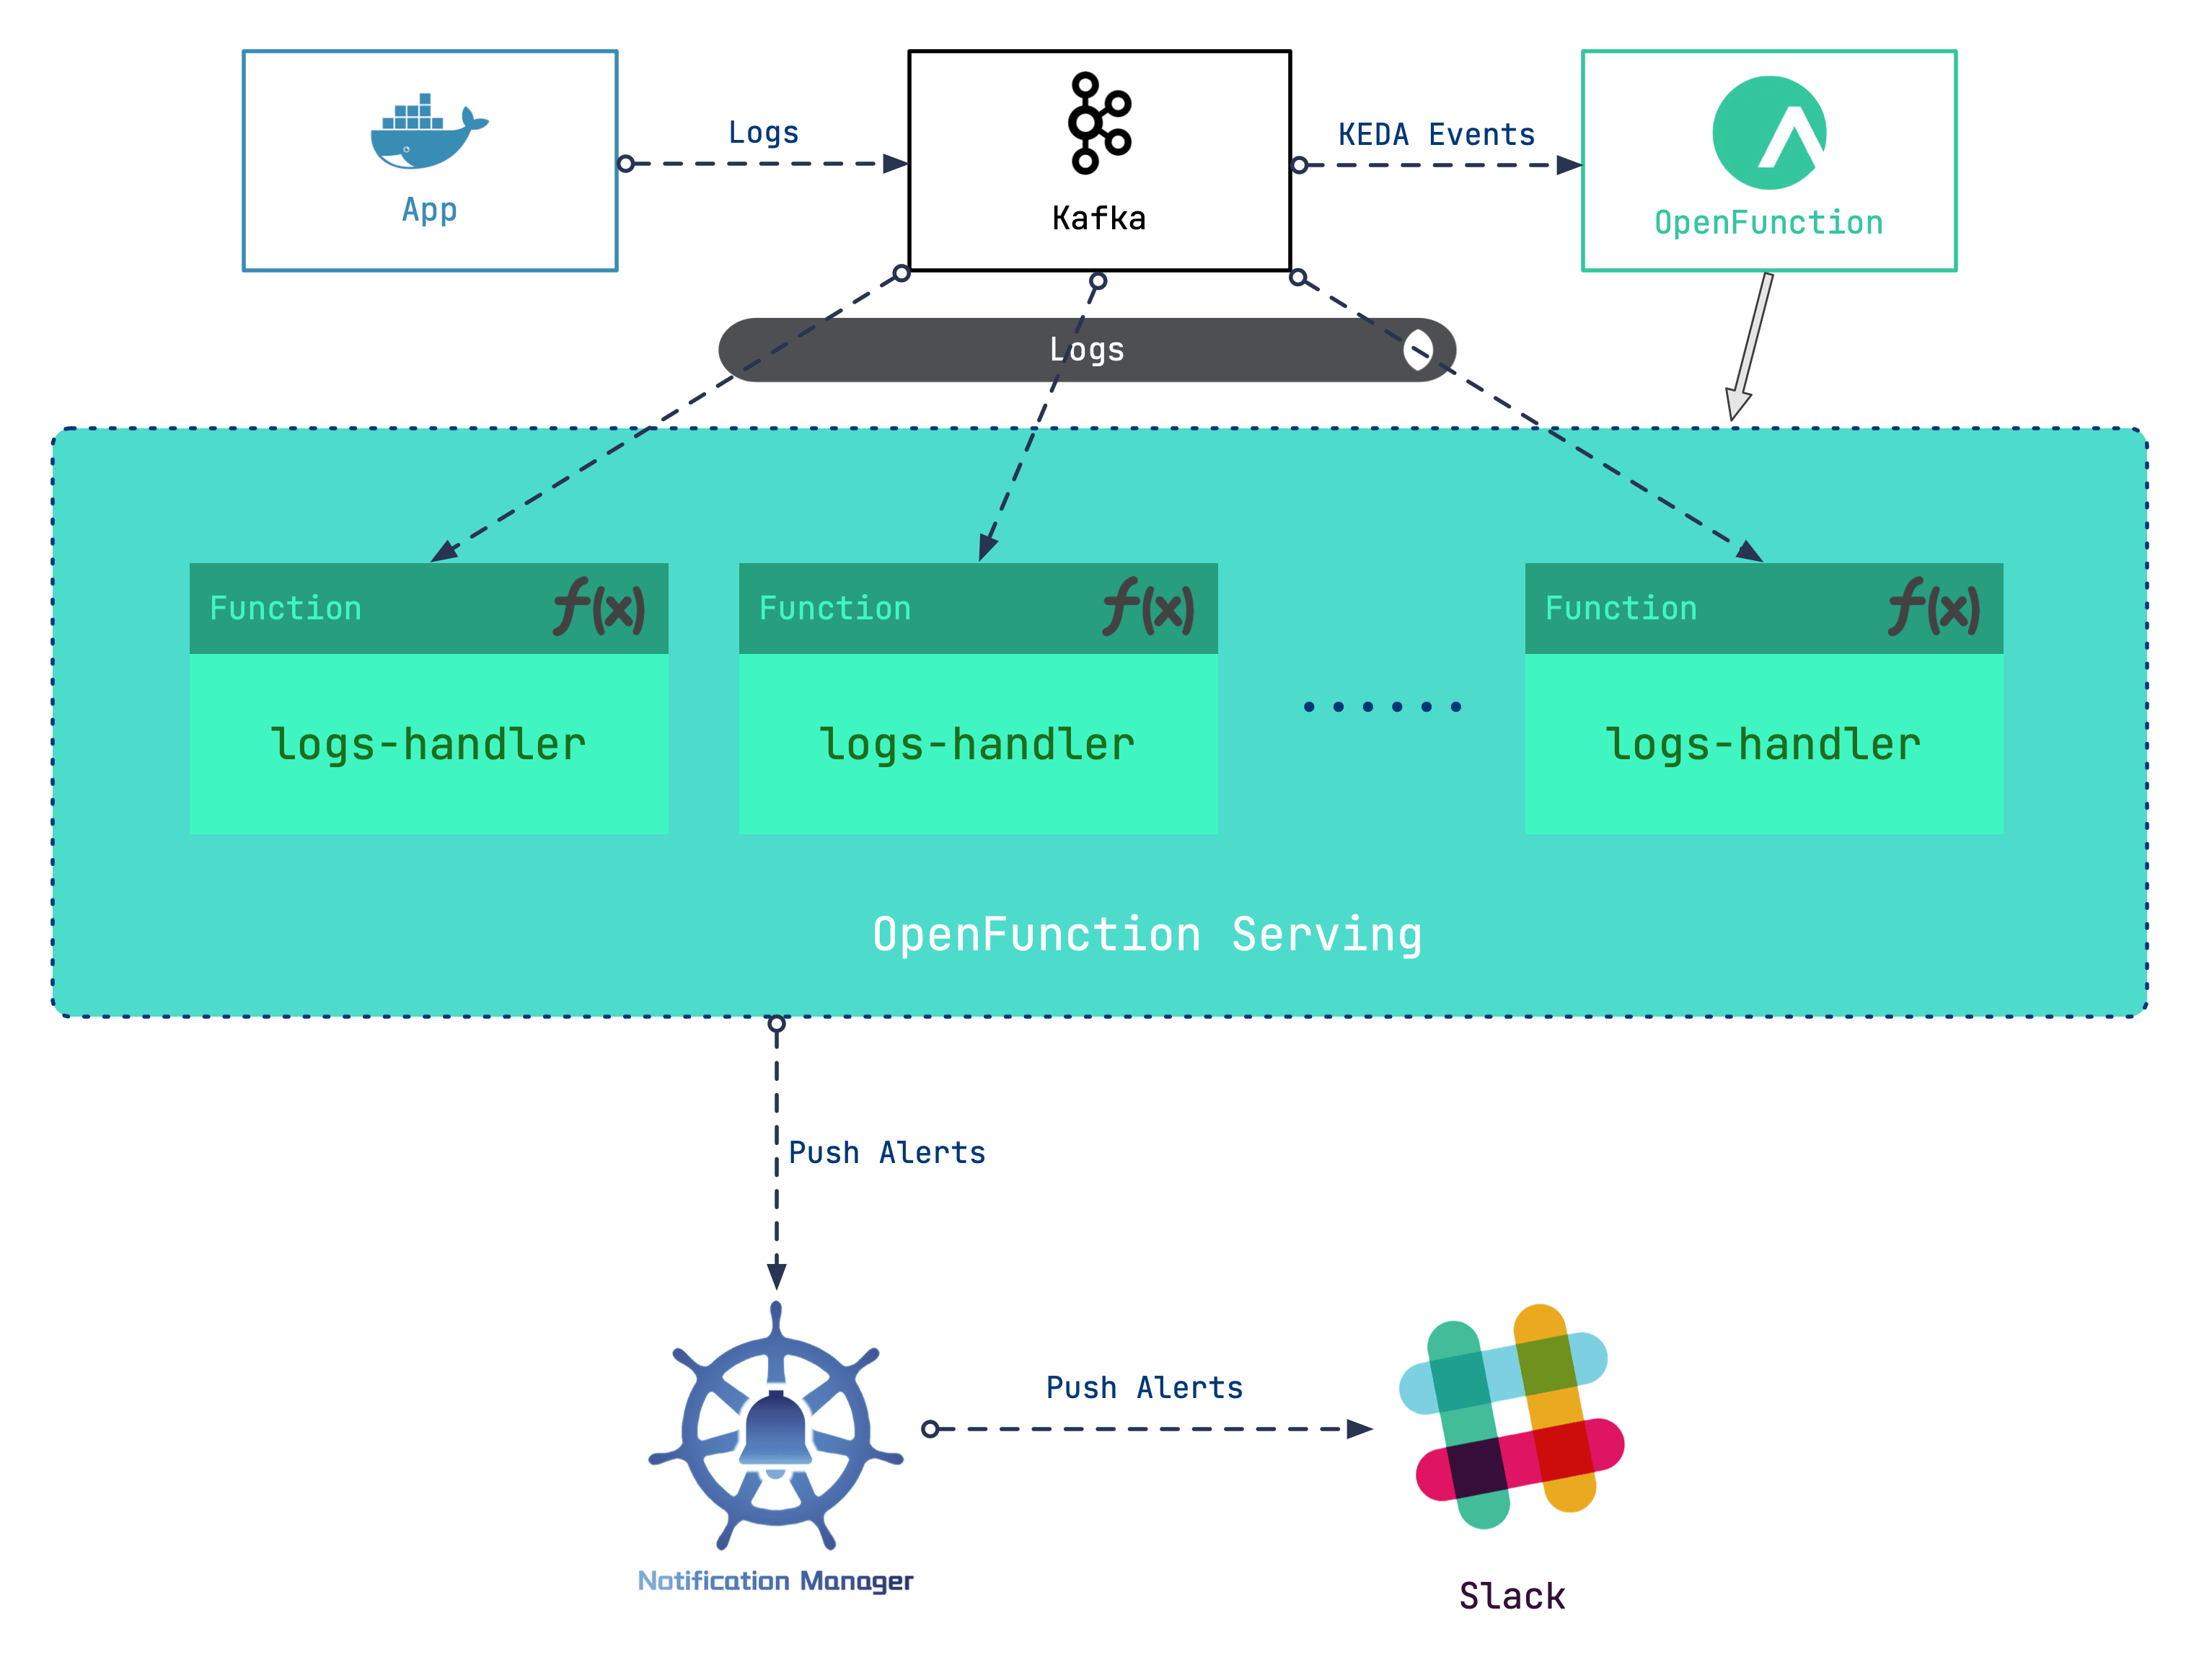
In this scenario, we will make use of the serverless capabilities of OpenFunction.
OpenFunction is an open-source FaaS (serverless) project initiated by the KubeSphere community. It is designed to allow users to focus on their business logic without the hassle of caring about the underlying operating environment and infrastructure. Currently, the project provides the following key capabilities:
- Builds OCI images from Dockerfile or Buildpacks.
- Runs serverless workloads using Knative Serving or OpenFunctionAsync (backed by KEDA + Dapr) as a runtime.
- Equipped with a built-in event-driven framework.
Use Kafka as a Log Receiver
First, enable the logging component for the KubeSphere platform (For more information, please refer to Enable Pluggable Components. Next, we can use strimzi-kafka-operator to build a minimal Kafka server.
In the
defaultnamespace, install strimzi-kafka-operator.helm repo add strimzi https://strimzi.io/charts/ helm install kafka-operator -n default strimzi/strimzi-kafka-operatorRun the following commands to create a Kafka cluster and a Kafka topic in the
defaultnamespace. The storage type of the created Kafka and ZooKeeper clusters is ephemeral. Here, we useemptyDirfor demonstration.Note that we have created a topic named
logsfor follow-up use.cat <<EOF | kubectl apply -f - apiVersion: kafka.strimzi.io/v1beta2 kind: Kafka metadata: name: kafka-logs-receiver namespace: default spec: kafka: version: 2.8.0 replicas: 1 listeners: - name: plain port: 9092 type: internal tls: false - name: tls port: 9093 type: internal tls: true config: offsets.topic.replication.factor: 1 transaction.state.log.replication.factor: 1 transaction.state.log.min.isr: 1 log.message.format.version: '2.8' inter.broker.protocol.version: "2.8" storage: type: ephemeral zookeeper: replicas: 1 storage: type: ephemeral entityOperator: topicOperator: {} userOperator: {} --- apiVersion: kafka.strimzi.io/v1beta1 kind: KafkaTopic metadata: name: logs namespace: default labels: strimzi.io/cluster: kafka-logs-receiver spec: partitions: 10 replicas: 3 config: retention.ms: 7200000 segment.bytes: 1073741824 EOFRun the following command to check the Pod's status and wait until Kafka and ZooKeeper runs and starts.
$ kubectl get po
NAME                                                   READY   STATUS        RESTARTS   AGE
kafka-logs-receiver-entity-operator-568957ff84-nmtlw   3/3     Running       0          8m42s
kafka-logs-receiver-kafka-0                            1/1     Running       0          9m13s
kafka-logs-receiver-zookeeper-0                        1/1     Running       0          9m46s
strimzi-cluster-operator-687fdd6f77-cwmgm              1/1     Running       0          11m
Run the following command to view metadata of the Kafka cluster:
# Starts a utility pod.
$ kubectl run utils --image=arunvelsriram/utils -i --tty --rm
# Checks metadata of the Kafka cluster.
$ kafkacat -L -b kafka-logs-receiver-kafka-brokers:9092
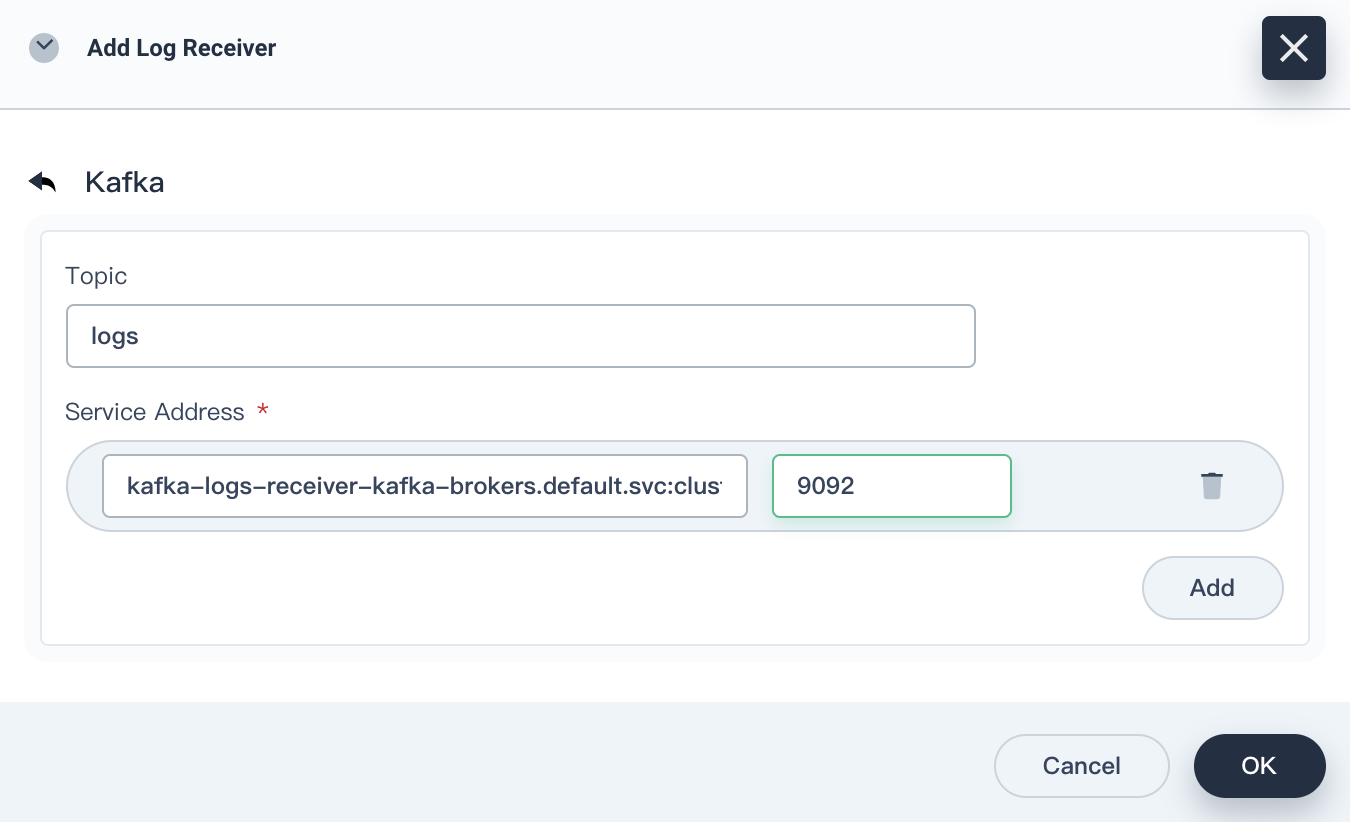
Add this Kafka server as a log receiver.
Log in to the web console of KubeSphere as admin. In the upper-left corner, choose Platform > Cluster Management.
If you have enabled the multi-cluster feature, you need to select a cluster.
On the Cluster Management page, click Log Collections under Cluster Settings.
Click Add Log Receiver, and then click Kafka. Enter the service address and port number of Kafka, and then click OK.
Run the following commands to verify that Kafka clusters can collect logs from Fluent Bit.
# Starts a utility pod.
$ kubectl run utils --image=arunvelsriram/utils -i --tty --rm
# Checks logs in the `logs` topic
$ kafkacat -C -b kafka-logs-receiver-kafka-0.kafka-logs-receiver-kafka-brokers.default.svc:9092 -t logs
Deploy OpenFunction
According to the design in Overview, we need to deploy OpenFunction first. As OpenFunction has referenced multiple third-party projects, such as Knative, Tekton, ShipWright, Dapr, and KEDA, it is cumbersome if you manually deploy it. It is recommended that you refer to Prerequisites to quickly deploy dependencies of OpenFunction.
In the command,
--with-shipwrightmeans that Shipwright is deployed as the build driver for the function;--with-openFuncAsyncmeans that OpenFuncAsync Runtime is deployed as the load driver for the function. When you have limited access to GitHub and Google, you can add the--poor-networkparameter to download related components.
sh hack/deploy.sh --with-shipwright --with-openFuncAsync --poor-network
Deploy OpenFunction.
We install the latest stable version here. Alternatively, you can use the development version. For more information, please refer to the Install OpenFunction section.
To make sure that Shipwright works properly, we provide a default build policy, and you can run the following commands to set the policy.
kubectl apply -f https://raw.githubusercontent.com/OpenFunction/OpenFunction/main/config/strategy/openfunction.yaml
kubectl apply -f https://github.com/OpenFunction/OpenFunction/releases/download/v0.3.0/bundle.yaml
Write a Log Processing Function
In this example, we install WordPress as the log producer. The application's workload resides in the demo-project namespace and the Pod's name is wordpress-v1-f54f697c5-hdn2z.
When a request returns 404, the log content is as follows:
{"@timestamp":1629856477.226758,"log":"*.*.*.* - - [25/Aug/2021:01:54:36 +0000] \"GET /notfound HTTP/1.1\" 404 49923 \"-\" \"curl/7.58.0\"\n","time":"2021-08-25T01:54:37.226757612Z","kubernetes":{"pod_name":"wordpress-v1-f54f697c5-hdn2z","namespace_name":"demo-project","container_name":"container-nrdsp1","docker_id":"bb7b48e2883be0c05b22c04b1d1573729dd06223ae0b1676e33a4fac655958a5","container_image":"wordpress:4.8-apache"}}
Here are our needs: When a request returns 404, the Notification Manager sends a notification to the receiver (Configure a Slack alert receiver according to Configure Slack Notifications, and records the namespace, Pod name, request path, request method, and other information. Therefore, we write a simple function:
You can learn how to use
openfunction-contextfrom OpenFunction Context Spec, which is a tool library provided by OpenFunction for writing functions. You can learn more about OpenFunction functions from OpenFunction Samples.
package logshandler

import (
	"encoding/json"
	"fmt"
	"log"
	"regexp"
	"time"

	ofctx "github.com/OpenFunction/functions-framework-go/openfunction-context"
	alert "github.com/prometheus/alertmanager/template"
)

const (
	HTTPCodeNotFound = "404"
	Namespace        = "demo-project"
	PodName          = "wordpress-v1-[A-Za-z0-9]{9}-[A-Za-z0-9]{5}"
	AlertName        = "404 Request"
	Severity         = "warning"
)

// The ctx parameter of the LogHandler function provides a context handle for user functions in the cluster. For example, ctx.SendTo is used to send data to a specified destination.
// The in parameter in the LogsHandle function is used to pass byte data (if any) from the input to the function.
func LogsHandler(ctx *ofctx.OpenFunctionContext, in []byte) int {
	content := string(in)
	// We set three regular expressions here for matching the HTTP status code, resource namespace, and Pod name of resources, respectively.
	matchHTTPCode, _ := regexp.MatchString(fmt.Sprintf(" %s ", HTTPCodeNotFound), content)
	matchNamespace, _ := regexp.MatchString(fmt.Sprintf("namespace_name\":\"%s", Namespace), content)
	matchPodName := regexp.MustCompile(fmt.Sprintf(`(%s)`, PodName)).FindStringSubmatch(content)

	if matchHTTPCode && matchNamespace && matchPodName != nil {
		log.Printf("Match log - Content: %s", content)

		// If the input data matches all three regular expressions above, we need to extract some log information to be used in the alert.
		// The alert contains the following information: HTTP method of the 404 request, HTTP path, and Pod name.
		match := regexp.MustCompile(`([A-Z]+) (/\S*) HTTP`).FindStringSubmatch(content)
		if match == nil {
			return 500
		}
		path := match[len(match)-1]
		method := match[len(match)-2]
		podName := matchPodName[len(matchPodName)-1]

		// After we collect major information, we can use the data struct of altermanager to compose an alert.
		notify := &alert.Data{
			Receiver:          "notification_manager",
			Status:            "firing",
			Alerts:            alert.Alerts{},
			GroupLabels:       alert.KV{"alertname": AlertName, "namespace": Namespace},
			CommonLabels:      alert.KV{"alertname": AlertName, "namespace": Namespace, "severity": Severity},
			CommonAnnotations: alert.KV{},
			ExternalURL:       "",
		}
		alt := alert.Alert{
			Status: "firing",
			Labels: alert.KV{
				"alertname": AlertName,
				"namespace": Namespace,
				"severity":  Severity,
				"pod":       podName,
				"path":      path,
				"method":    method,
			},
			Annotations:  alert.KV{},
			StartsAt:     time.Now(),
			EndsAt:       time.Time{},
			GeneratorURL: "",
			Fingerprint:  "",
		}
		notify.Alerts = append(notify.Alerts, alt)
		notifyBytes, _ := json.Marshal(notify)

		// Use ctx.SendTo to send the content to the "notification-manager" output (you can find its definition in the following logs-handler-function.yaml function configuration file.
		if err := ctx.SendTo(notifyBytes, "notification-manager"); err != nil {
			panic(err)
		}
		log.Printf("Send log to notification manager.")
	}
	return 200
}
Upload this function to the code repository and record the URL of the code repository and the path of the code in the repository, which will be used in the Create a function step.
You can find this case in OpenFunction Samples.
Create a Function
Use OpenFunction to build the above function. First, set up a key file push-secret to access the image repository (After the OCI image is constructed using the code, OpenFunction will upload the image to the image repository for subsequent load startup.):
REGISTRY_SERVER=https://index.docker.io/v1/ REGISTRY_USER=<your username> REGISTRY_PASSWORD=<your password>
kubectl create secret docker-registry push-secret \
    --docker-server=$REGISTRY_SERVER \
    --docker-username=$REGISTRY_USER \
    --docker-password=$REGISTRY_PASSWORD
Apply the function configuration file logs-handler-function.yaml.
The function definition explains the use of two key components:
Dapr shields complex middleware from applications, making it easy for the
logs-handlerfunction to handle Kafka events.KEDA drives the startup of the
logs-handlerfunction by monitoring event traffic in the message server, and dynamically extends thelogs-handlerinstance based on the consumption delay of Kafka messages.
apiVersion: core.openfunction.io/v1alpha1
kind: Function
metadata:
  name: logs-handler
spec:
  version: "v1.0.0"
  # Defines the upload path for the built image.
  image: openfunctiondev/logs-async-handler:v1
  imageCredentials:
    name: push-secret
  build:
    builder: openfunctiondev/go115-builder:v0.2.0
    env:
      FUNC_NAME: "LogsHandler"
    # Defines the path of the source code.
    # url specifies the URL of the above-mentioned code repository.
    # sourceSubPath specifies the path of the code in the repository.
    srcRepo:
      url: "https://github.com/OpenFunction/samples.git"
      sourceSubPath: "functions/OpenFuncAsync/logs-handler-function/"
  serving:
    # OpenFuncAsync is an event-driven, asynchronous runtime implemented in OpenFunction by using KEDA_Dapr.
    runtime: "OpenFuncAsync"
    openFuncAsync:
      # This section defines the function input (kafka-receiver) and the output (notification-manager), which correspond to definitions in the components section.
      dapr:
        inputs:
          - name: kafka-receiver
            type: bindings
        outputs:
          - name: notification-manager
            type: bindings
            params:
              operation: "post"
              type: "bindings"
        annotations:
          dapr.io/log-level: "debug"
        # This section defines the above-mentioned input and output (that is, Dapr Components).
        components:
          - name: kafka-receiver
            type: bindings.kafka
            version: v1
            metadata:
              - name: brokers
                value: "kafka-logs-receiver-kafka-brokers:9092"
              - name: authRequired
                value: "false"
              - name: publishTopic
                value: "logs"
              - name: topics
                value: "logs"
              - name: consumerGroup
                value: "logs-handler"
          # This is the URL of KubeSphere notification-manager.
          - name: notification-manager
            type: bindings.http
            version: v1
            metadata:
              - name: url
                value: http://notification-manager-svc.kubesphere-monitoring-system.svc.cluster.local:19093/api/v2/alerts
      keda:
        scaledObject:
          pollingInterval: 15
          minReplicaCount: 0
          maxReplicaCount: 10
          cooldownPeriod: 30
          # This section defines the trigger of the function, that is, the log topic of the Kafka server.
          # This section also defines the message lag threshold (the value is 10), which means that when the number of lagged messages exceeds 10, the number of logs-handler instances will automatically scale out.
          triggers:
            - type: kafka
              metadata:
                topic: logs
                bootstrapServers: kafka-logs-receiver-kafka-brokers.default.svc.cluster.local:9092
                consumerGroup: logs-handler
                lagThreshold: "10"
Demonstrate the Result
Disable the Kafka log receiver first: On the Log Collections page, click Kafka to go to the details page, and choose More > Change Status > Close.
Wait for a while, and then it can be observed that number of instances of the logs-handler function has reduced to 0.
Then set the status of the Kafka log receiver to Collecting, and logs-handler also starts.
~# kubectl get po --watch
NAME                                                     READY   STATUS        RESTARTS   AGE
kafka-logs-receiver-entity-operator-568957ff84-tdrrx     3/3     Running       0          7m27s
kafka-logs-receiver-kafka-0                              1/1     Running       0          7m48s
kafka-logs-receiver-zookeeper-0                          1/1     Running       0          8m12s
logs-handler-serving-kpngc-v100-zcj4q-5f46996f8c-b9d6f   2/2     Terminating   0          34s
strimzi-cluster-operator-687fdd6f77-kc8cv                1/1     Running       0          10m
logs-handler-serving-kpngc-v100-zcj4q-5f46996f8c-b9d6f   2/2     Terminating   0          36s
logs-handler-serving-kpngc-v100-zcj4q-5f46996f8c-b9d6f   0/2     Terminating   0          37s
logs-handler-serving-kpngc-v100-zcj4q-5f46996f8c-b9d6f   0/2     Terminating   0          38s
logs-handler-serving-kpngc-v100-zcj4q-5f46996f8c-b9d6f   0/2     Terminating   0          38s
logs-handler-serving-kpngc-v100-zcj4q-5f46996f8c-9kj2c   0/2     Pending       0          0s
logs-handler-serving-kpngc-v100-zcj4q-5f46996f8c-9kj2c   0/2     Pending       0          0s
logs-handler-serving-kpngc-v100-zcj4q-5f46996f8c-9kj2c   0/2     ContainerCreating   0          0s
logs-handler-serving-kpngc-v100-zcj4q-5f46996f8c-9kj2c   0/2     ContainerCreating   0          2s
logs-handler-serving-kpngc-v100-zcj4q-5f46996f8c-9kj2c   1/2     Running             0          4s
logs-handler-serving-kpngc-v100-zcj4q-5f46996f8c-9kj2c   2/2     Running             0          11s
Next, initialize a request for a non-existent path of the WordPress application:
curl http://<wp-svc-address>/notfound
You can see that Slack has received this message (Slack will not receive an alert message when we visit the WordPress site properly).

Explore More Possibilities
We can further discuss a solution using synchronous functions:
To use Knative Serving properly, we need to set the load balancer address of its gateway. (You can use the local address as a workaround.)
# Repalce the following "1.2.3.4" with the actual values.
$ kubectl patch svc -n kourier-system kourier \
-p '{"spec": {"type": "LoadBalancer", "externalIPs": ["1.2.3.4"]}}'

$ kubectl patch configmap/config-domain -n knative-serving \
-type merge --patch '{"data":{"1.2.3.4.sslip.io":""}}'
OpenFunction drives the running of the Knative function in two ways: (1) Use the Kafka server in asynchronous mode; (2) Use its own event framework to connect to the Kafka server, and then operate in Sink mode. You can refer to the case in OpenFunction Samples.
In this solution, the processing speed of synchronous functions is lower than that of asynchronous functions. We can also use KEDA to trigger the concurrency mechanism of Knative Serving, but it is not as convenient as asynchronous functions. (In the future, we will optimize the OpenFunction event framework to make up for the shortcomings of synchronous functions.)
It can be seen that different types of serverless functions have their unique advantages depending on task scenarios. For example, when it comes to handling an orderly control flow function, a synchronous function outperforms an asynchronous function.
Summary
Serverless matches our expectations for rapid disassembly and reconstruction of business scenarios.
As you can see in this case, OpenFunction not only increases flexibility of log processing and alert notification links by using the serverless technology, but also uses a function framework to simplify complex setups typically required to connect to Kafka into semantically clear code. Moreover, we are also continuously developing OpenFunction so that components can be powered by our own serverless capabilities in follow-up releases.
Table of Contents
